Fig. 6.
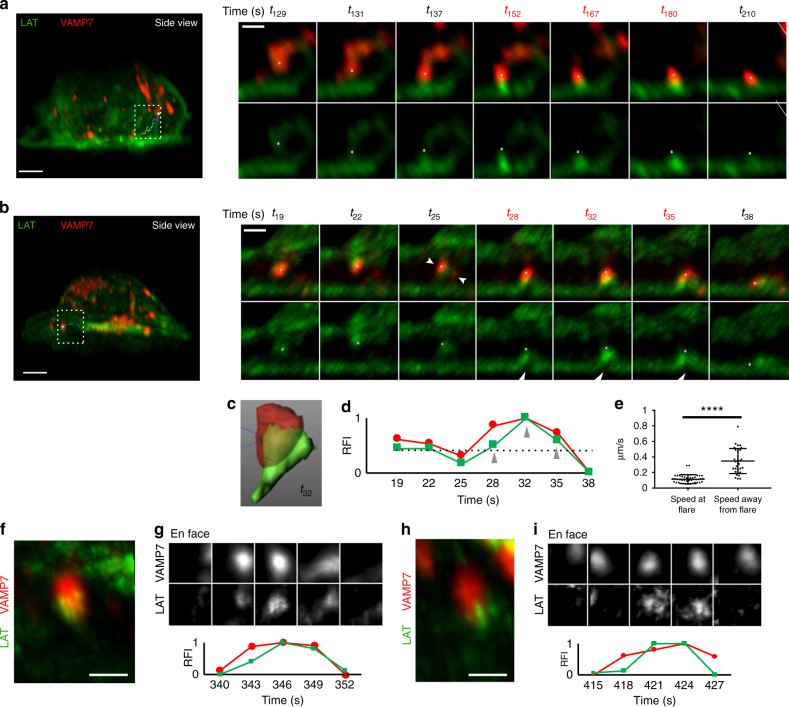
LAT and VAMP7 dynamics at later times after activation. Lattice light sheet images of Jurkat cells transfected with LAT-neon green and Halo-VAMP7, dropped onto stimulatory coverslips, and imaged 5 min after initial stimulation. a, b The left panel shows the side view of the entire cell. The boxed region highlights a vesicle track. The tracked vesicle is a gray sphere. The entire track is shown and color-coded to indicate time, with the earliest time point in blue and the latest time point in red. Right panels show zoomed-in views of the vesicle. The top panel shows LAT (green) and VAMP7 (red), while the bottom panel shows LAT only. a A VAMP7 vesicle moving from the inside of the cell to the stimulated surface is shown and in b a VAMP7 vesicle moving from the center of the cell to the periphery is shown. In b white indented arrowheads in t25 top panel indicate two VAMP7 vesicles that fuse. White arrowheads in t28, t32, and t35 indicate the plasma membrane lifting up. Scale bars for a and b left panels equal 2 μm and right panels equal 0.5 μm. c Segmented VAMP7 (red) and LAT (green) at a flare event corresponding to t32 in b. d Relative fluorescence intensity (RFI) plots of VAMP7 (red) and LAT (green) intensity sums within the segmented VAMP7 vesicle shown in c over time. Gray arrowheads indicate the times that show the “flare” event. e Speed of VAMP7 vesicles away from and at the site of a flare were graphed. f, h Zoomed-in views of VAMP7 vesicles showing an increase in LAT fluorescence at the vesicle tip as it touches down on the plasma membrane. Scale bars equal 0.5 μm. g, i Top panels show time series showing LAT and VAMP7 increases in an en face view of the plasma membrane. Lower panels show relative fluorescence intensity (RFI) plots of VAMP7 (red) and LAT (green) (n = 5 cells, three independent experiments). See also Supplementary Figure 4

