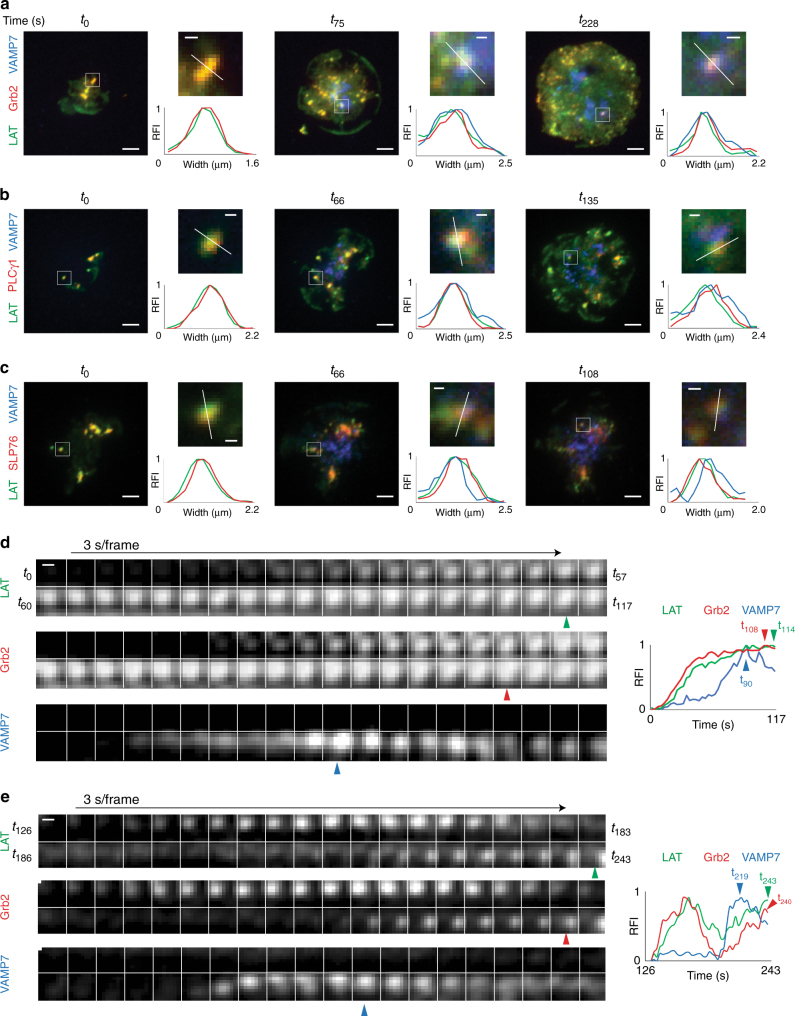
Fig. 7.
Microcluster composition before and after VAMP7 recruitment. a–c Jurkat cells were transfected with a LAT-Halo, Grb2-scarlet, and emerald-VAMP7, b LAT-ruby, PLCγ1-Halo, and emerald-VAMP7, or c LAT-ruby, SLP76-Halo, and emerald-VAMP7, dropped onto stimulatory coverslips, and imaged by TIRF microscopy. Indicated time points are shown with t0 corresponding to the earliest observable time point. For each time point, the upper-right image was magnified from the region marked by a white box in the left image, and the bottom-right graph shows the relative fluorescence intensity (RFI) measured across the width of the white line in the corresponding upper-right image. a–c Scale bars in left images equal 2 μm. Scale bars in upper-right images equal 0.5 μm (n = 6 cells for Grb2, 4 cells for PLCγ1 and SLP-76; three independent experiments). d, e Left panels show time-lapse montage at 3 s/frame graphs of a single microcluster and kinetics of recruitment of LAT, Grb2, and VAMP7. On the right, relative fluorescence intensity (RFI) plots of the time-lapse montage are shown. Blue arrowheads indicate peak VAMP7 fluorescence, red arrowheads indicate peak Grb2 fluorescence (d) or increased Grb2 fluorescence once VAMP7 is recruited (e) and green arrowheads indicate peak LAT fluorescence (d) or increased LAT fluorescence post VAMP7 recruitment (e). Scale bars equal 0.5 μm. See also Supplementary Figure 5

