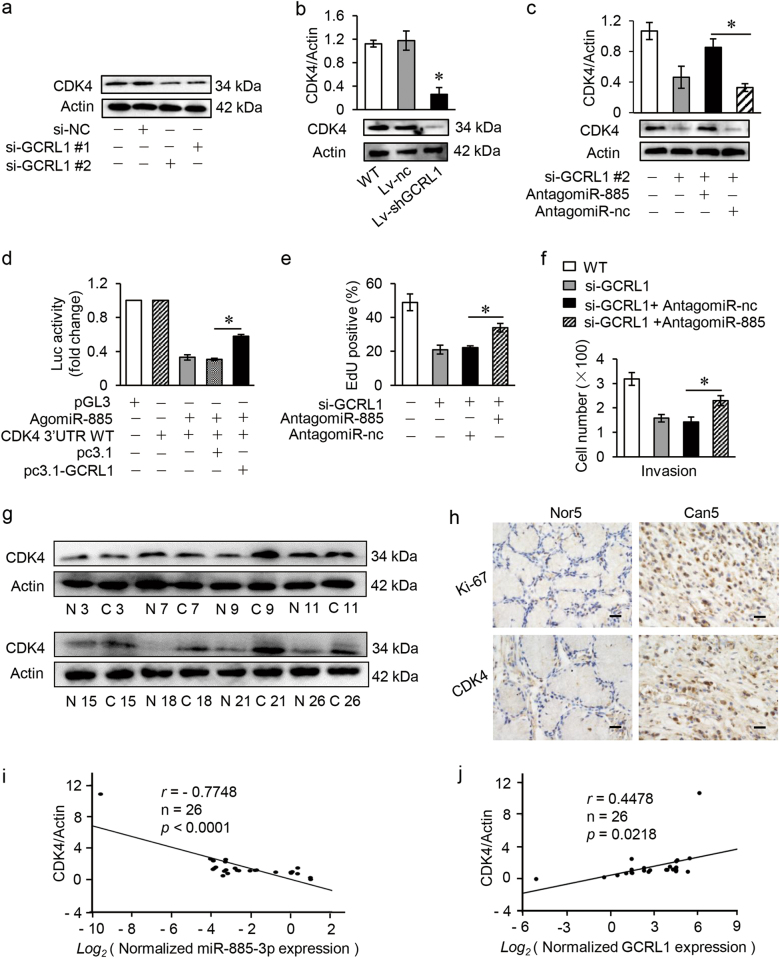
Fig. 7. GCRL1 regulates the proliferation and metastasis of GC via miR-885-3p and CDK4.
a Expression levels of CDK4 detected by western blotting in BGC-823 cells with GCRL1 knockdown (n = 3). b Expression levels of CDK4 detected by western blotting in mice tumor tissues, quantitated with ImageJ and shown as relative CDK4/Actin expression levels (up) and representative results were shown (down) (n = 3). c Expression levels of CDK4 detected by western blotting in BGC-823 cells after co-transfection with si-GCRL1 #2 and AntagomiR-nc, or with si-GCRL1 #2 and AntagomiR-885, quantitated with ImageJ and shown as relative CDK4/Actin expression levels (up) and representative results were shown (down) (n = 3). d Relative luciferase assay assessing the interaction between GCRL1, miR-885-3p, and CDK4 (n = 3). e Cell proliferation rescue assay was performed in GCRL1-silenced BGC-823 cells transfected with AntagomiR-885 or AntagomiR-nc, and results were shown as the percentage of EdU-positive cells to Hoechst-positive cells (n = 3). (f) Cell invasion assay was processed in GCRL1-silenced BGC-823 cells transfected with AntagomiR-885 or AntagomiR-nc, and results were shown as the number of invaded cells per field (n = 3). g Expression levels of CDK4 determined by western blotting in patient tissues of gastric cancer compared to adjacent non-tumor tissues, with β-actin as controls (n = 8). h Expression levels of CDK4 detected in gastric cancer tissues of patients by immunohistochemical assay and representative images were shown, with ki-67 as controls (scale bars = 50 μm). i The association between miR-885-3p and CDK4 protein levels was identified with Pearson correlation analysis, r = - 0.7748. j The association between GCRL1 and CDK4 protein levels was identified with Pearson correlation analysis, r = 0.4478. Data are expressed as mean ± SD, *p < 0.05 compared to Lv-nc (b), AntagomiR-nc (c, e, f), and pc3.1 (d)

