Figure 4.
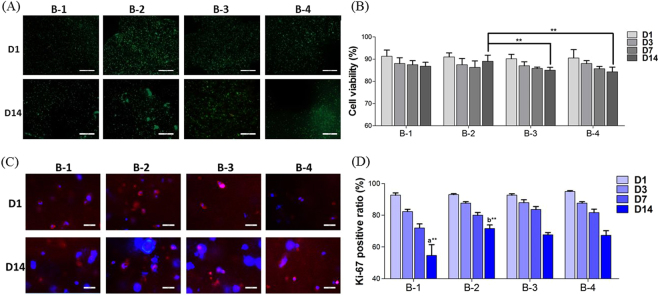
Cell viability and proliferation within 3D constructs (A) Representative images of Live/Dead staining of 3D bioprinted constructs at Day1 and Day14 of culture (Scale bar: 200 μm); (B) Live/Dead cell counting and quantitative analysis at Day1, 3, 7 and 14 of culture(**p < 0.01); (C) Representative images of Ki-67 staining of 3D bioprinted constructs at Day1 and Day14 of culture (Scale bar: 50 μm); (D) Ki-67 positive cell counting and quantitative analysis at Day1, 3, 7 and 14 of culture (a: **p < 0.01 compared with B-2, B-3 and B-4 at Day14; b: **p < 0.01 compared with B-3 and B-4 at Day14).

