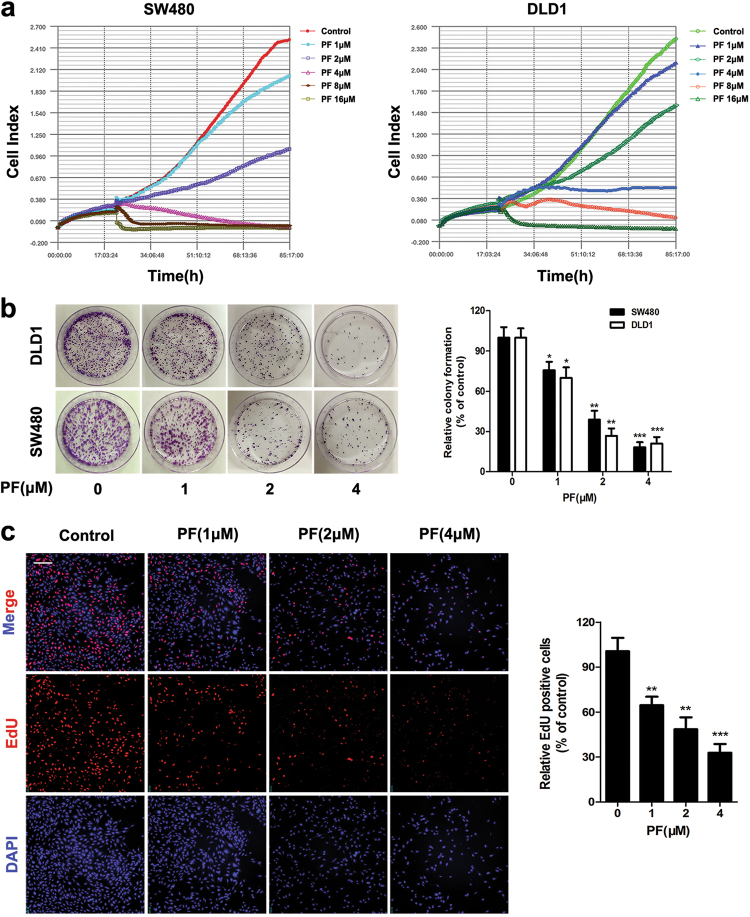
Fig. 3. PF suppressed the proliferation of CRC cells.
a SW480 and DLD1 cells were cultured in E-plates for 20 h, and then treated with different concentrations of PF. Cell proliferation was monitored continuously by using an xCELLigence RTCA system. b SW480 and DLD1 cells were treated with different concentrations of PF for 14 days, and colony formation was assessed by staining with crystal violet. Data represent the means ± SD (n = 3), *P < 0.05, **P < 0.01 and ***P < 0.001, compared with 0 μM group. c After treatment with indicated concentrations of PF in SW480 cells for 24 h, EdU labelling assay was performed and the cells were were observed by ImageXpress® Micro Confocal. Data represent the means ± SD (n = 3), **P < 0.01, ***P < 0.001, compared with 0 μM group, scale bars = 50 μm

