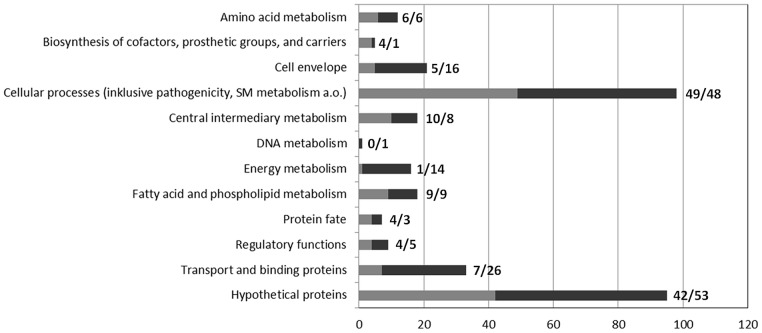
FIGURE 5.
Functional classification of genes differentially expressed in the ΔgvmR mutant. Genes that were up- and downregulated in the ΔgvmR mutant as compared with wild type are indicated in black and gray, respectively. The number of genes per functional category is shown at the bottom. The number of down- and upregulated genes per functional category are shown next to the bars (down/up).

