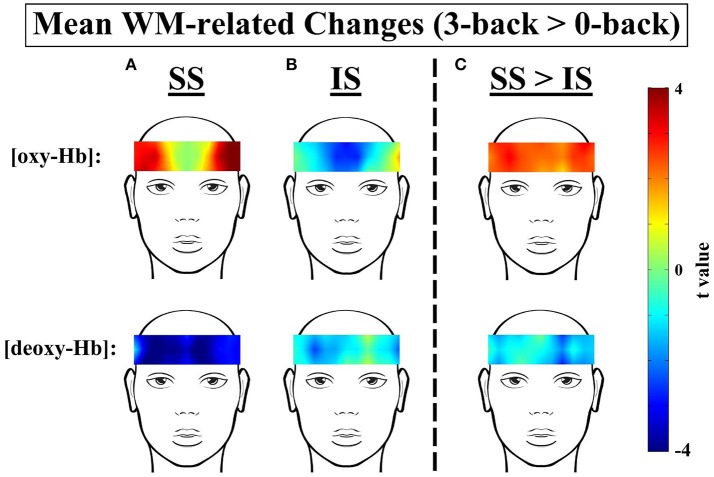
Figure 5.
t-Contrast maps of the mean working-memory-related (WM-related, i.e., 3-back > 0-back) [oxy-Hb] and [deoxy-Hb] changes in the (A) Sufficient Sleep (SS; n = 20) and (B) Insufficient Sleep (IS; n = 20) groups and (C) between the SS and IS groups. For the top panels of (A,B), red and blue indicate WM-related [oxy-Hb] increases and decreases, respectively; for the bottom panels of (A,B), red and blue indicate WM-related [deoxy-Hb] increases and decreases, respectively. In addition, for the top panel of (C), red indicates greater WM-related [oxy-Hb] increases in the SS group; for the bottom panel of (C), blue indicates greater WM-related [deoxy-Hb] decreases in the SS group.

