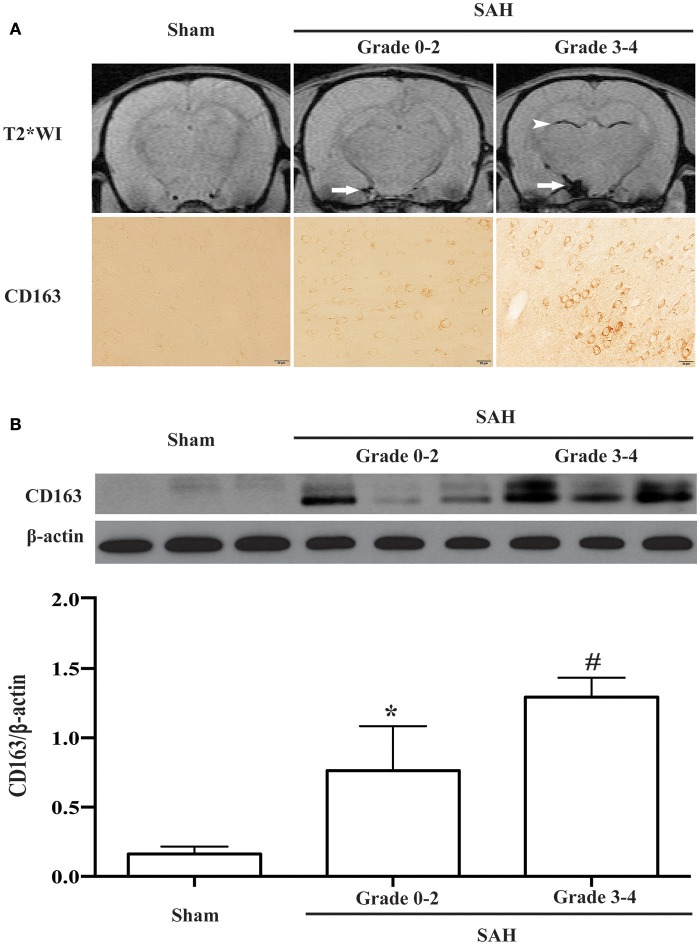
Figure 4.
(A) Representative T2* weighted MRI for SAH grading and corresponding CD163 immunoreactivity at day 1 following SAH or a sham operation. On the T2* weighted images (T2WI), arrows point to the subarachnoid blood masses and arrowheads point to intraventricular blood clots. Scale bar = 20 μm. (B) CD163 expression in the ipsilateral cortex at day 1 following SAH of different grades (0-2 or 3-4) or a sham operation as assessed by Western blot. Values are means±SD, *p < 0.05 grade 0-2 vs. the other groups; #p < 0.01 grade 3-4 vs. sham, n = 3, one-way ANOVA.

