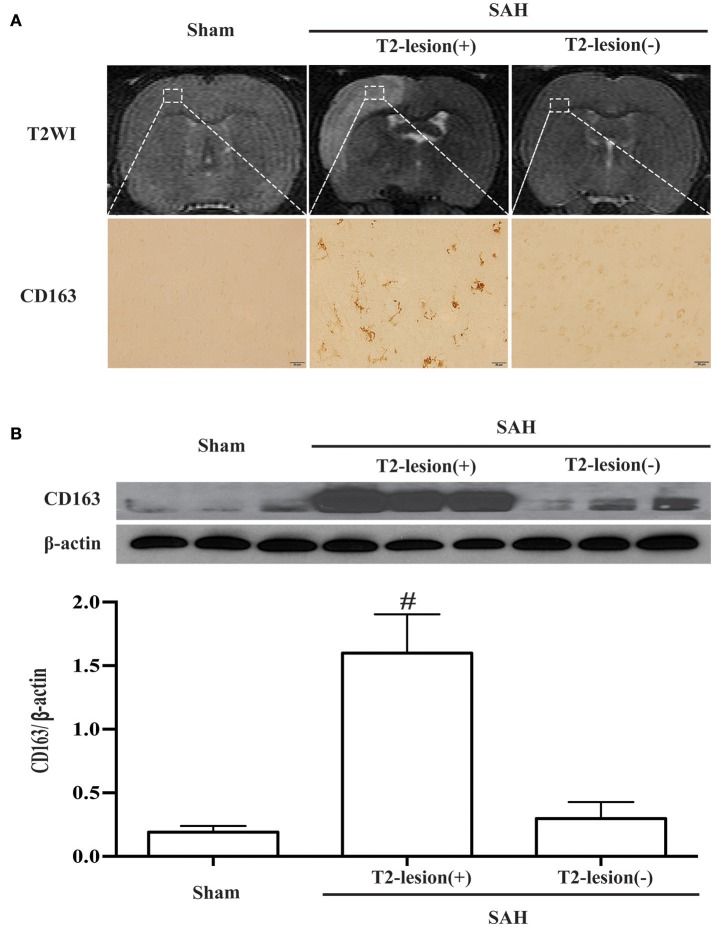
Figure 5.
SAH-induced lesions were identified on T2 weighted MRI (T2WI). (A) Representative example of a T2 lesion 1 day after SAH [T2-lesion (+)] compared to images from a sham-operated rat and an SAH rat with no lesion [T2-lesion (–)]. Corresponding CD163 immunoreactivity in ipsilateral cortex from the box area is shown below. Scale bar = 20 μm. (B) Western blots were used to quantify CD163 protein levels in the ipsilateral cortex at day 1 in sham operated and SAH rats with and without a T2 lesion. Values are mean±SD, #p < 0.01, T2-lesion (+) vs. the other groups, n = 3, one-way ANOVA.

