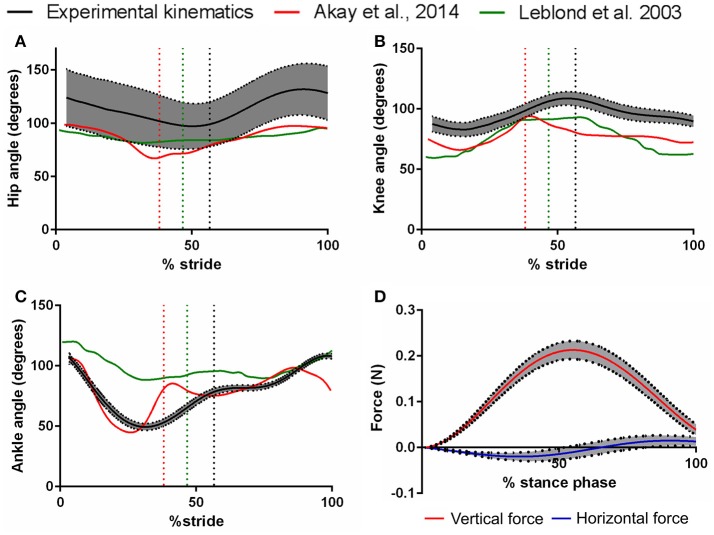
Figure 2.
Mean angles (5 mice, 44 trials, ± 95% confidence intervals) of the hip (A), knee (B), and ankle (C) joints of the mouse hindlimb over one trotting stride, as measured with digitisation of markers from high-speed video. Walking hindlimb kinematics (mean traces) from Akay et al. (2014) and Leblond et al. (2003) are also shown for comparison and validation. Dashed vertical lines represent the swing-stance transitions of the corresponding stride (i.e., this study had longer swing phases from its faster speeds, relative to the other studies plotted here). Also shown in (D): the mean (±95% confidence intervals) ground reaction forces exerted on the mouse hindlimb throughout the stance phase of one running stride, along the vertical (dorsal-ventral), and horizontal (cranial-caudal) axes.

