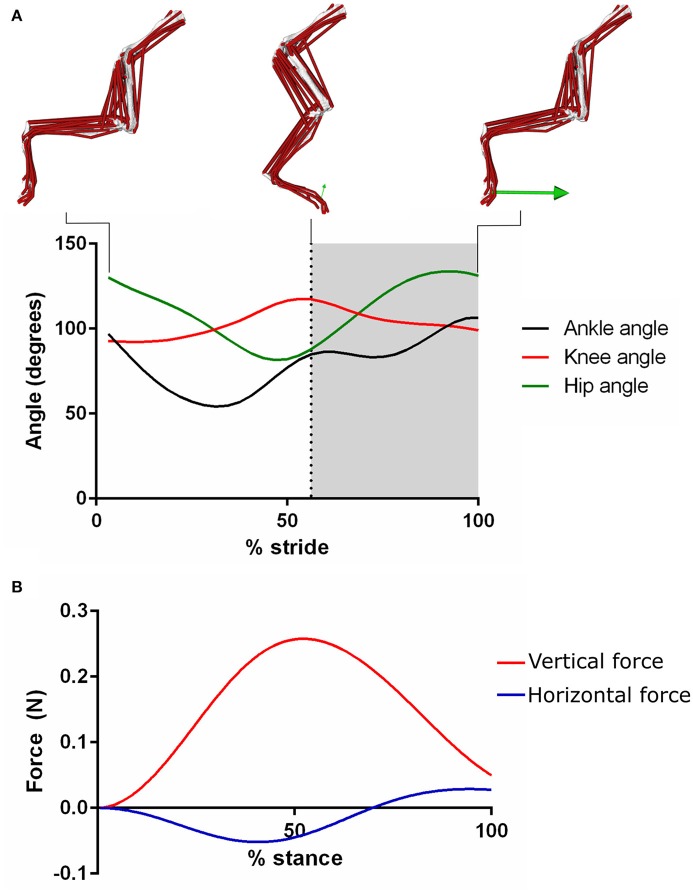
Figure 5.
The experimentally derived joint angles (A), and ground reaction forces (B) used to create the dynamic simulation of trotting within the mouse hindlimb. The green arrow represents the ground reaction force vector. Positive angles represent hip flexion, knee extension and ankle plantarflexion. Negative angles represent hip extension, knee flexion and ankle dorsiflexion. The gray area indicates the stance phase.

