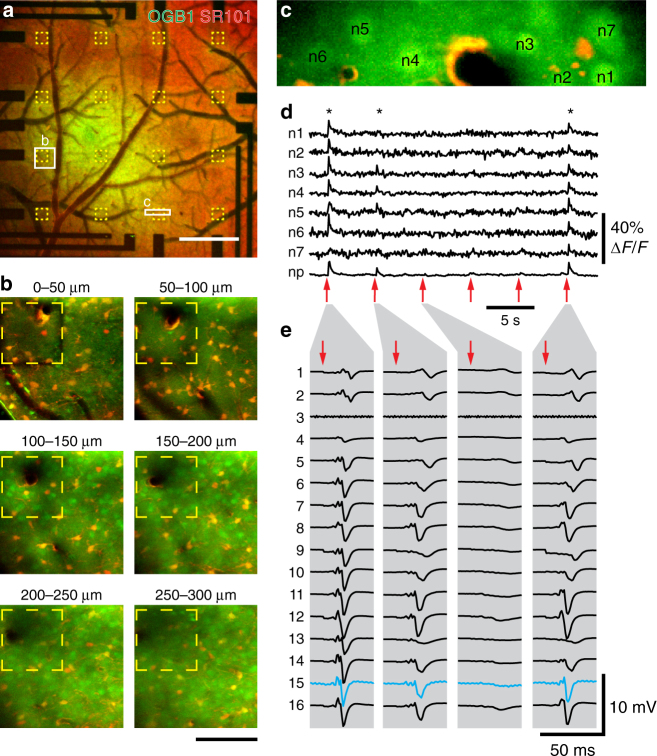
Fig. 3.
Combination of 2-photon-based calcium imaging with electrical recordings. Before placement of the graphene microelectrode array, the calcium indicator Oregon Green 488 BAPTA-1 (OGB1) AM ester was pressure-microinjected and astrocytes were stained with Sulforhodamine 101 (SR101). a Overview image of OGB1 (green) and SR101 (red) staining below the graphene microelectrode array. Yellow outlines indicate single graphene electrodes, white rectangles indicate imaging sites shown in b and c. Scale bar, 500 µm. b Two-photon imaging of OGB1 (green) and SR101 (red) below a single graphene electrode (yellow outline). Maximum intensity projections (MIPs) of images acquired at different depths (step size: 3 µm) below the cortical surface are shown (MIP range indicated above individual images). Scale bar, 100 µm. c Image of the region (size: 140 µm × 32.6 µm) used for functional Ca2+ imaging as shown in d. In the center, a vessel (dark) passes the imaging plane. For analysis, images were segmented into individual neurons (n1–n7; bright OGB1, no SR101 staining), astrocytes (bright OGB1 and SR101 staining), and neuropil (OGB1 staining, no SR101 staining). d Calcium traces (OGB1 fluorescence change relative to pre-stimulus baseline, ΔF/F) of individual neurons (n1–n7 as shown in c) and neuropil (np). Single electric stimuli (300 µs, 1 mA) were delivered every 5 s (red arrows) to the whisker pad. Imaging was performed 150 µm below the cortical surface at 12 Hz with 2-photon excitation at 800 nm and a power of 50 mW. Asterisks (*) indicate “responsive” trials. e Corresponding electrical responses to electrical whisker pad stimulation (red arrow) measured with graphene microelectrode array; traces from four individual trials matching stimulations no. 1, 2, 3, and 6 in d are shown. Graphene electrodes are numbered 1 (top left in a) to 16 (lower right in a); electrode 3 is non-functional and 2-photon Ca2+ imaging was performed right below electrode 15 (highlighted in blue), leading to slightly increased noise in this channel. Artifacts resulting from electrical stimulation were removed by linear interpolation

