Fig. 5.
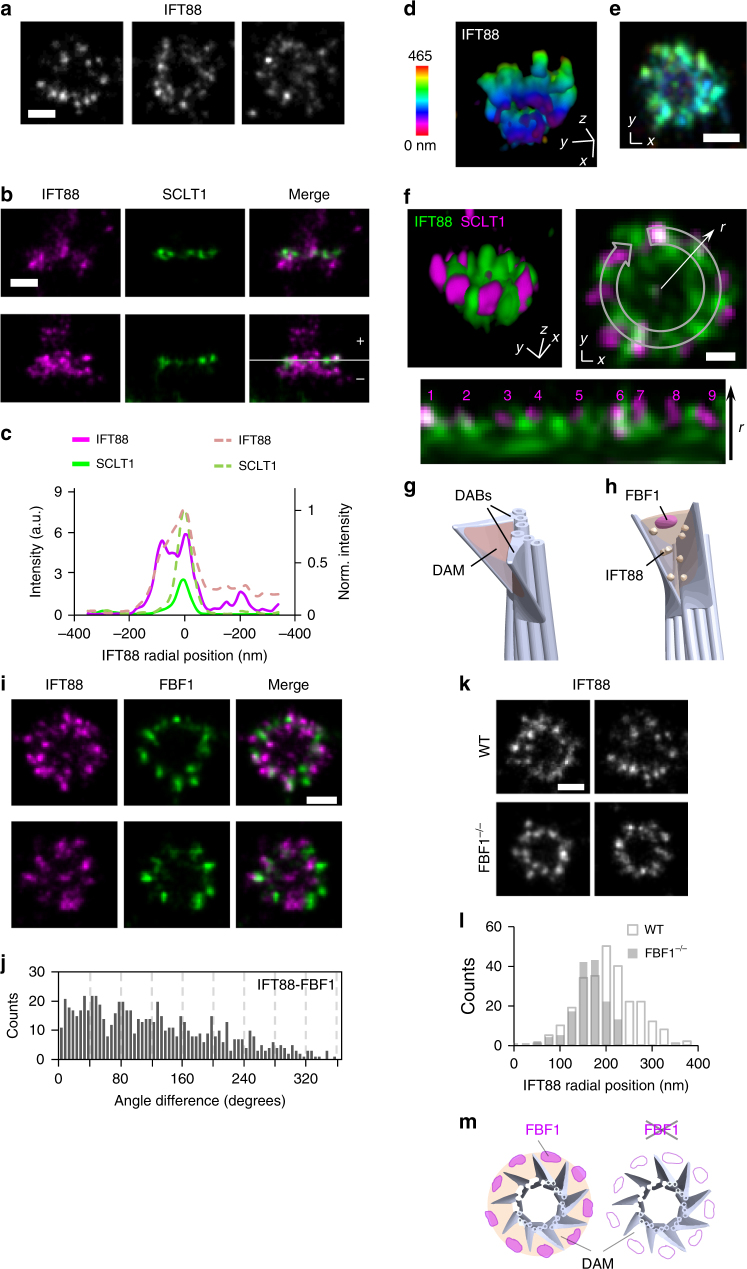
Localization of IFT88 revealing a distal appendage matrix (DAM). a Three representative axial-view dSTORM images of IFT88 reveal a broad angular distribution without a clear nine-fold symmetric pattern. b Two representative sets of two-color images showing IFT88 spanning a longitudinal range relative to the location of SCLT1 (marked with a dashed line). The solid line in c depicts the distribution in the lower panel in b, whereas the dotted line illustrates normalized distributions averaged over nine data pairs. d, e 3D STORM imaging of IFT88 showing the tapered distribution of IFT88 that is wider at the distal end of the DAP region. f Three-dimensional two-color super-resolution image revealing IFT88 proteins in the gaps between neighboring SCLT1 regions, as shown in the lower image (derived from the upper-right image) in which nine SCLT1 puncta are numbered accordingly. g The region between adjacent DABs is designated as the DAM. h Model showing the localization of FBF1 and IFT88 at the DAM. i Two-color imaging of IFT88-FBF1 shows the angular coincidence between IFT88 and FBF1 at the DAM. j Histogram of angular spacing between IFT88 and FBF1. k, l The radial distribution of IFT88 was reduced in FBF1−/− cells. m Model showing a functional role of FBF1 in maintaining the DAM spatial arrangement. Bars = 200 nm for all, except f (100 nm)

