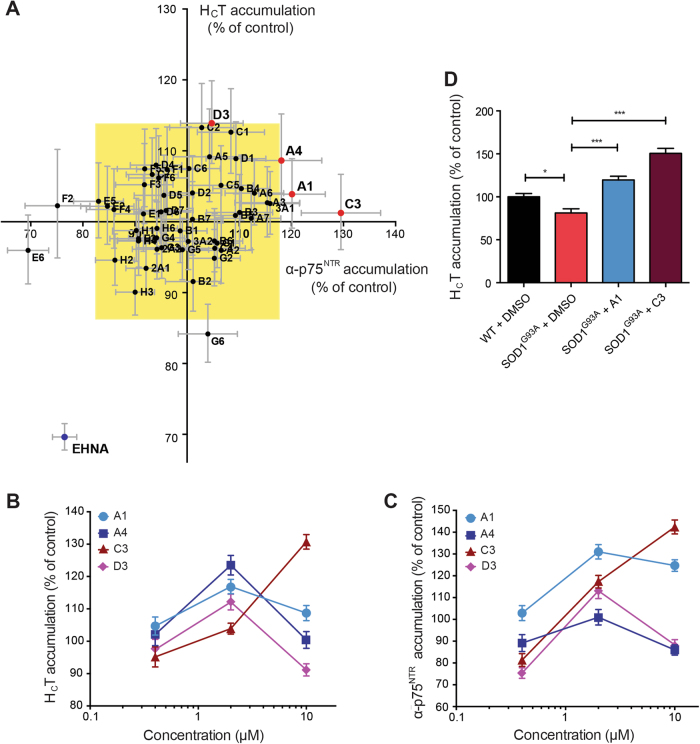
Fig. 2. Chemical screen for the identification of enhancers of HCT and α-p75NTR accumulation in the soma of ES cell-derived motor neurons.
a The results of a small-molecule chemical screen are shown as an XY plot of the normalized mean staining intensity for α-p75NTR versus AlexaFluor 555-conjugated HCT. α-p75NTR was detected using an AlexaFluor 647-conjugated donkey anti-rabbit secondary antibody. Active compounds (red dots) were defined as those able to increase accumulation of α-p75NTR and HCT by at least three times the standard deviation of the dataset (represented by the yellow rectangle). The negative control (EHNA) is shown in blue (n ≥ 25 cell bodies analysed per condition; n = 3 repeats). b, c Dose–response analysis of the top four active compounds identified by the screening displayed in A. The accumulation assay was performed at 0.4, 2 and 10 μM and the amount of HCT (b) and α-p75NTR (c) in the soma was quantified as the mean staining intensity per pixel ( ± SEM) (n ≥ 25 cell bodies per condition, n = 3 repeats). d Effects of 2 μM A1 and C3 on the accumulation of HCT in the cell body of primary motor neurons isolated from E13 SOD1G93A embryos (DIV6). The amount of HCT was quantified as described in B, C and shown as mean ± SEM. Significance levels were determined using the Kruskal–Wallis test followed by Dunn’s multiple comparisons test. n = 3 repeats; *** p < 0.001; * p < 0.05

