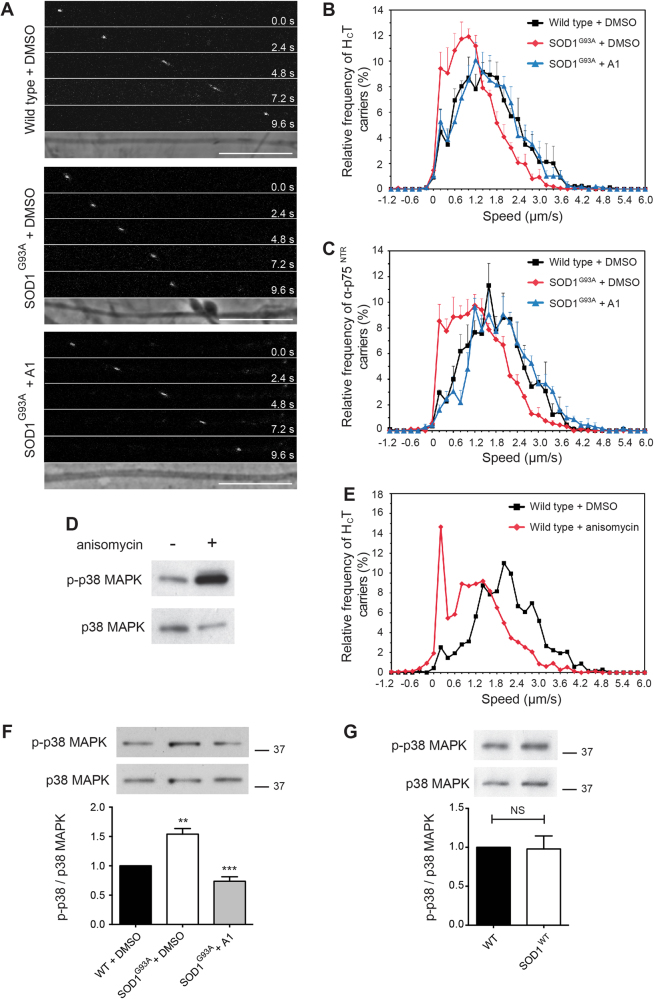
Fig. 3. Impaired axonal retrograde transport can by normalised by pre-treatment with a p38 MAPK inhibitor in embryonic SOD1G93A motor neurons.
a Frames from confocal time series of HCT-labelled endosomes in wild type + DMSO (top), SOD1G93A + DMSO (middle) and SOD1G93A + 2 μM A1 (bottom) axons. Scale bars, 10 μm. b Speed profiles of HCT carriers in wild type + DMSO (black squares), SOD1G93A + DMSO (red diamonds) and SOD1G93A + 2 μM A1 (blue triangles) motor neuron cultures. Comparison of the curves reveals SOD1G93A motor neurons treated with compound A1 have a similar speed distribution to wild-type cultures (wild type: 94 carriers, 13 axons; SOD1G93A: 126 carriers, 14 axons; SOD1G93A + 2 μM A1: 121 carriers, 16 axons; 4 independent experiments; data shown as mean ± SEM). c Speed distribution profiles of α-p75NTR carriers in wild type + DMSO, SOD1G93A + DMSO (vehicle control) and SOD1G93A + 2 μM A1 motor neuron cultures (wild type: 118 carriers, 6 axons; SOD1G93A: 85 carriers, 6 axons; SOD1G93A + 2 μM A1: 96 carriers, 8 axons; 3 independent experiments; data shown as mean ± SEM). d Treatment of wild-type motor neuron cultures with 0.5 μg/ml anisomycin (1.9 μM) for 30 min causes a substantial activation of p38 MAPK (upper panel; detected with a phosphospecific pT180/pY182 α-p38 MAPK antibody). The total content of p38 MAPK in the samples is shown in the lower panel (pan α-p38 MAPK antibody). e Speed profiles of HCT carriers in motor neuron cultures treated with either DMSO (black squares) or 1.9 μM anisomycin (red diamonds). Anisomycin causes a shift to slower transport speeds (DMSO treated: 77 carriers, 8 axons; anisomycin treated: 76 carriers, 8 axons; 3 independent experiments; data shown as mean ± SEM). f Western blot showing activation of p38 MAPK in primary SOD1G93A motor neuron cultures compared to wild-type controls. Compound A1 normalises phospho-p38 MAPK in SOD1G93A cultures to wild-type levels (top). The upper panel was stained as in panel D. Quantification reveals a 1.5 fold increase in phospho-p38 MAPK in SOD1G93A motor neuron cultures compared to wild-type cells, and confirms the normalisation of p38 MAPK activity by compound A1 (bottom) (n = 3 independent experiments). Data shown as mean ± SEM. ** p < 0.01, *** p < 0.001 (one-way ANOVA followed by Sidak’s multiple comparison test). g Western blot showing active p38 MAPK in motor neurons overexpressing the SOD1WT protein compared to wild-type controls (top). Western blot quantification detected no significant difference in p38 MAPK activation between wild-type cultures and motor neurons overexpressing SOD1WT (bottom) (n = 3 independent experiments). Data shown as mean ± SEM. Non-significant (NS) using unpaired Student’s t-test

