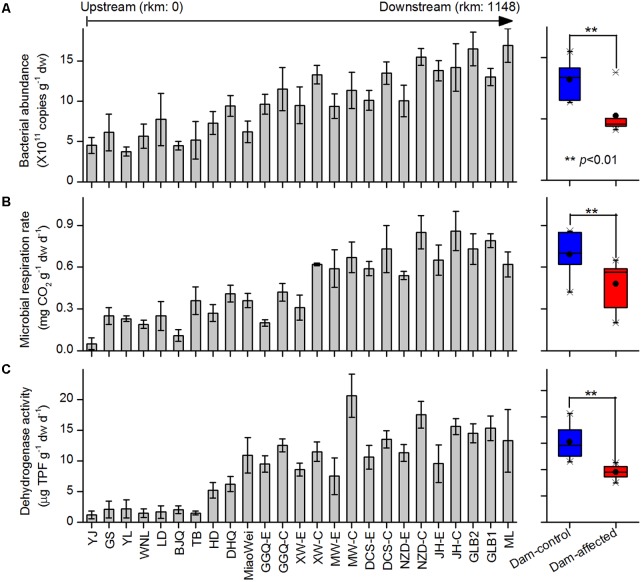
FIGURE 2.
Bacterial abundance (A), microbial respiration rate (B), and dehydrogenase activity (C) in the sediments from the 25 sampling sites along the Lancang River from upstream to downstream (boxplot on the right shown the difference between the dam-control and dam-affected sites; a straight line inside the box indicates the median of the values, while a solid circle indicates the mean; the box indicates the 25 and 75% percentiles of the values; the whiskers indicate the maximum and minimum of the values).

