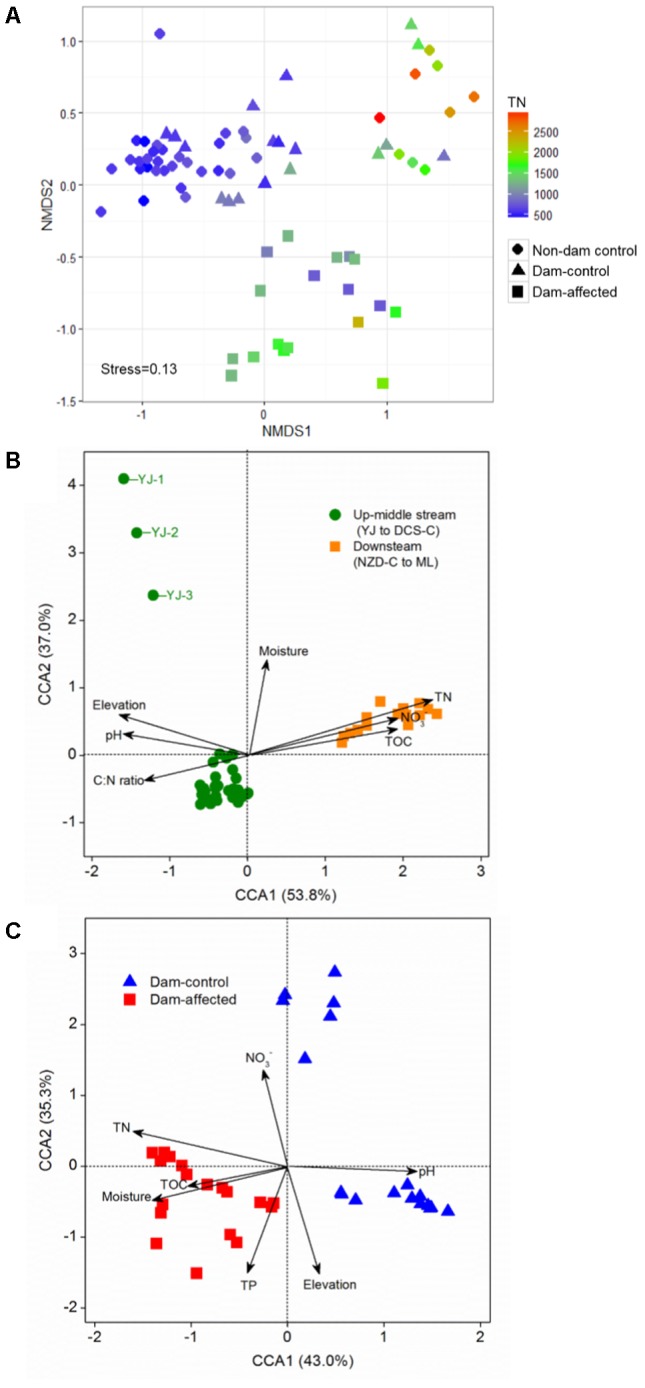
FIGURE 4.

Bacterial community compositions of all 75 sediment samples as indicated by non-metric multidimensional scaling plots (NMDS) (A) and canonical correspondence analysis (CCA) of the geochemical factors and bacterial communities in the samples from all the control sites (B) and the six-dam cascade area sites (C). Sampling plots in (A) have been color-coded according to the sediment total nitrogen (TN) content.
