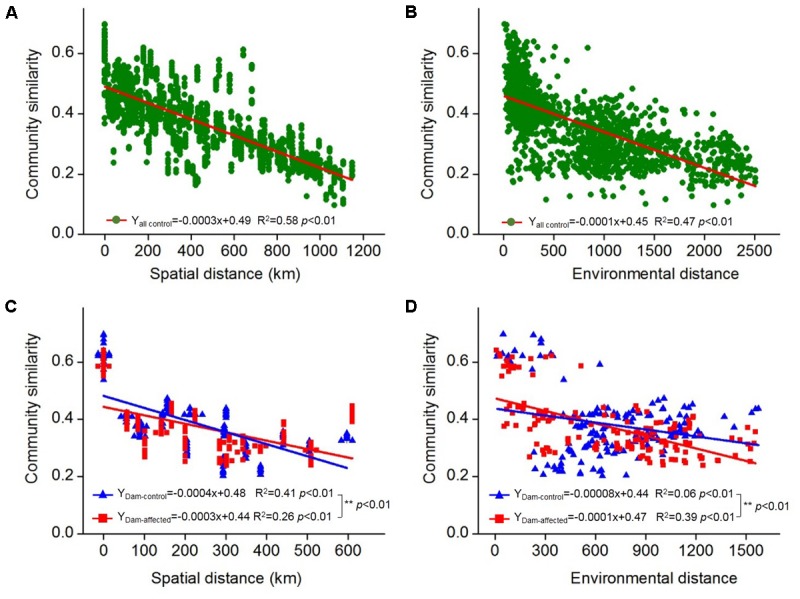
FIGURE 5.

Distance–decay relationships between the bacterial community similarity, spatial distance, and environmental distance in all the control sediments (A,B) and the six-dam cascade area sites (C,D). The slopes were compared pairwise between the dam-control and the dam-affected sediments with permutation tests and ∗∗ represents the significant differences when p ≤ 0.01.
