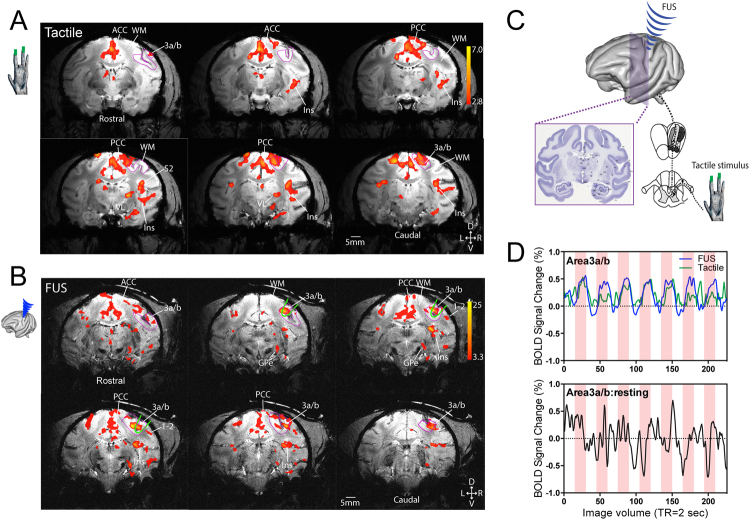
Figure 1.
Comparison of tactile stimulus-evoked and Focused ultrasound stimulation (FUS)-elicited fMRI BOLD activations in the macaque brain. (A) Representative single run coronal fMRI activation maps evoked by 8 Hz stimulation of distal finger pads of digits 2&3 of left hand of subject 1. Activation maps are thresholded at t > 2.8, p = 0.005, q = 0.012, FDR corrected. (B) Representative single run coronal fMRI activation maps evoked by FUS stimulation of the areas 3a/3b region of right hemisphere of subject 2. Activation maps are thresholded at t > 3.3, p = 0.001, q = 0.003, FDR corrected. Green oval outlines indicate the focus (25% power) locations of the ultrasound beam. Magenta outlines show the areas 3a/3b region. WM: white matter. ACC: anterior cingulate cortex. PCC: posterior cingulate cortex. Ins: insular cortex. 3a/b: areas 3a and 3b. 1–2: areas 1 and 2. VL: thalamic ventral-lateral nucleus. GPe: globus pallidus. D: dorsal. V: ventral. L: left. R: right. Six coronal images are arranged from rostral to caudal direction (top left to bottom right). (C) A diagram shows the two experimental conditions examined in the study: peripheral tactile stimulation of digits and direct cortical stimulation with FUS. (D) BOLD signal time courses derived from areas 3a/3b voxels during tactile and ultrasound stimulation (top panel) and at rest (without stimulation, bottom panel). Light pink background strips indicate the stimulus duration, they are for reference only in the resting state panel.

