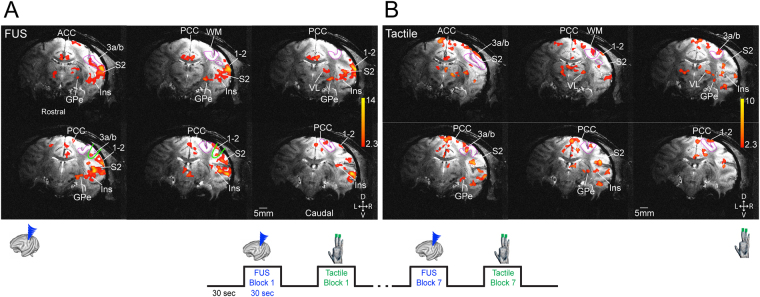
Figure 2.
Interleaved presentation of FUS and tactile stimulation evoked similar fMRI activation patterns. (A) A single run BOLD fMRI activation map evoked by FUS of area 3a/3b region of right hemisphere. (B) Tactile stimulus-evoked fMRI activation maps. Activation maps are thresholded at t > 2.3, p < 0.02, q = 0.03, FDR corrected. Magenta outlines show the areas 3a/3b region. D: dorsal. V: ventral. L: left. R: right. D: dorsal. Bottom insert illustrates the stimulus (FUS and tactile) presentation protocol. Six rostral to caudal coronal images are arranged from top left to bottom right. V: ventral. L: left. R: right.

