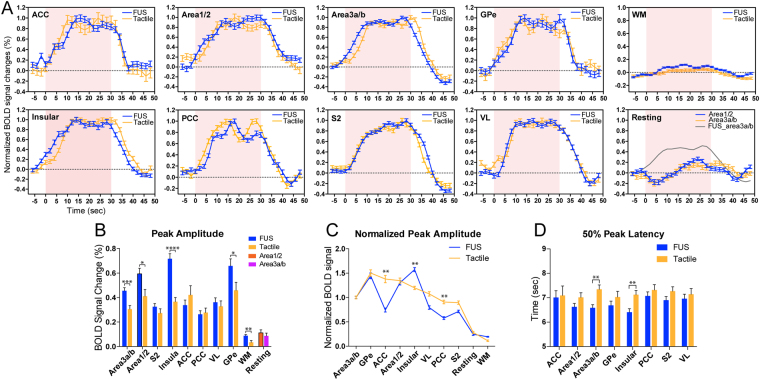
Figure 3.
Group comparison of BOLD time courses, signal amplitude, rising slopes, and response latency during tactile versus FUS stimulation in different brain regions. (A) Normalized BOLD time courses (peak is considered as 1) derived from eight activated regions (by either tactile stimulation or FUS) and two control conditions: white matter (WM) region and at resting state. Shadows indicate the standard error distribution. Light pink background strips indicate the 30-sec stimulation period. (B) Comparison of absolute peak BOLD% signal changes evoked by tactile stimulation versus FUS in each individual ROI. *p < 0.05, **p < 0.01, ***p < 0.005, ****p < 0.001, unpaired t-test. (C) Rearranged normalized BOLD signal changes plot (signal of areas 3a/3b is considered as 1) from high to low for tactile stimulation and corresponding values for FUS. *p < 0.05, **p < 0.01, nonparametric Mann-Whitney test. (D) Direct comparisons of 50% peak latency in each ROI. **p < 0.01, unpaired t-test. FMRI data from a total of 13 tactile and 19 FUS runs from six imaging sessions in two animals were included in the group quantification.

