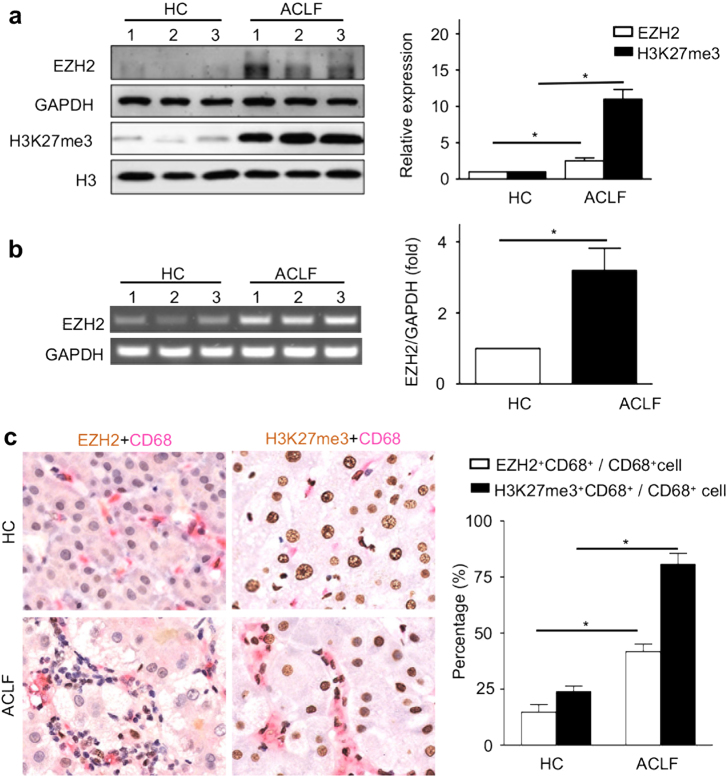
Fig. 1. EZH2 and H3K27me3 production in ACLF patients.
Comparison of EZH2 and H3K27me3 in PBMC between HC (n = 10) and ACLF (n = 10) were performed, using western blot (a) and RT-PCR (b). The bars represented bands density ratios of EZH2/GAPDH or H3K27me3/H3. *, P < 0.05. c It was illustrated that representative images of double staining immunohistochemistry [EZH243 and CD68 (red) or H3K27me343 and CD68 (red)] of liver from HC (n = 3) and ACLF (n = 3). Intrahepatic EZH2+CD68+ cells and H3K27me3+CD68+ cells were counted, and CD68+ cells were calculated using software ImagePro Plus 7.2. Percentage analysis of EZH2+CD68+ / CD68+ cells and H3K27me3+CD68+ / CD68+ cells was performed (n = 3). *, P < 0.05

