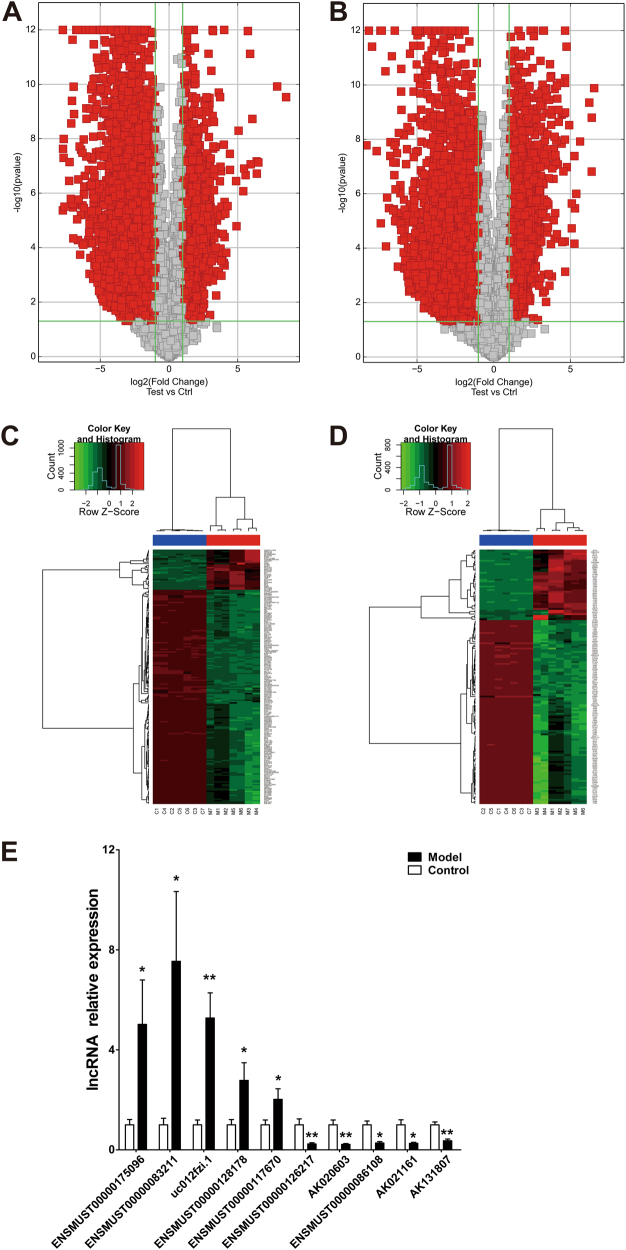
Fig. 2. Microarray analysis for identification of differentially expressed lncRNAs and mRNAs between damaged livers and healthy controls.
a Volcano plot of differentially expressed lncRNAs between hepatic damage models and controls. N = 7 for each group. b Volcano plot of differentially expressed mRNAs between CCl4 and control groups. N = 7 for each group. Two longitudinal green lines are fold change lines in a and b. Red symbols indicate downregulation >50% (left) or upregulation >2.0-fold change (right) in CCl4-treated mice relative to the control counterparts. The horizontal green line represents P < 0.05. Ctrl and Test represent control and CCl4 groups, respectively. c The Hierarchical clustering heatmap of differentially expressed lncRNAs between damaged livers and healthy controls. N = 7 for each group. d The Hierarchical clustering heatmap of differentially expressed mRNAs between damaged livers and healthy controls. Red color indicates high relative expression, and green indicates low relative expression. N = 7 for each group. C represents control group, and M represents CCl4 group. e Verification of microarray results with qRT-PCR. N = 3 for each group. *P < 0.05 and **P < 0.01 vs. control

