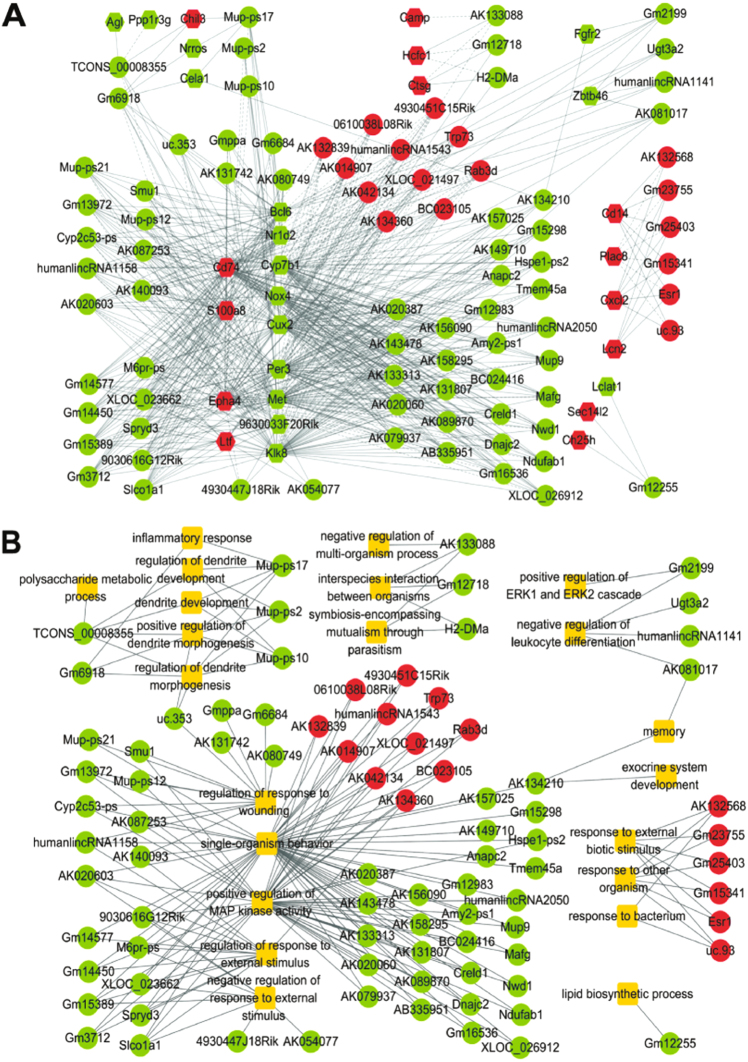
Fig. 4. Network analysis for the potential functions of differentially expressed lncRNAs in damaged livers.
a The co-expression network of differentially expressed lncRNAs and mRNAs. b The network of differentially expressed lncRNAs and biological process (BP) terms of their specific target genes. A round node represents a lncRNA, a hexagon node an mRNA, and a yellow rectangle node a BP term. Red color indicates upregulation and green downregulation. Solid lines represent positive correlation, and dash lines negative correlation. The width of the solid lines corresponds to −log10 (p)

