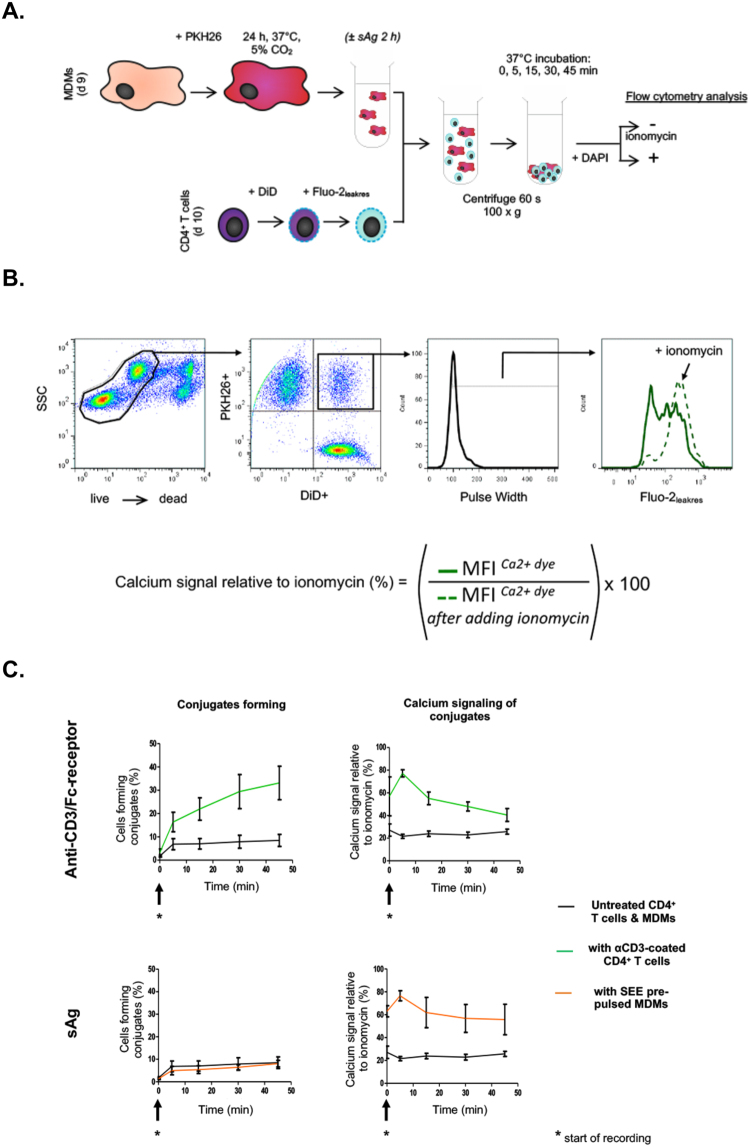
Figure 1.
Flow cytometry strategy to assess the frequency and signaling of MDM-CD4+ T cell conjugates. (A) Schematic diagram describing the experimental protocol developed; MDMs labeled with the lipophilic membrane dye PKH26 were exposed or not to sAg (1 µg/ml SEE), before incubation with Fluo-2leakres loaded CD4+ T cells pre-labeled with a distinct lipophilic membrane dye (DiD); DAPI stained samples were exposed or not to ionomycin and analyzed by flow cytometry (>10,000 events acquired per sample). (B) Gating strategy and output metrics. Pulse Width gated Fluo-2leakres Mean Fluorescence Intensity signal (MFI; green bold line) was expressed as a percentage of the signal within the same gate after adding ionomycin to the sample (green dotted line). (C) Graphs showing cell conjugate formation over time and the intensity of calcium signals within these conjugates, for T cells pre-coated with an anti-CD3 antibody (OKT3, 5 µg/ml; Anti-CD3/Fc receptor panel), presented to SEE pre-pulsed MDMs (1 µg/ml; sAg panel) or to untreated MDMs (black lines). Each graph represents the mean (±SD) from experiments performed on cells from N = 3 donors.

