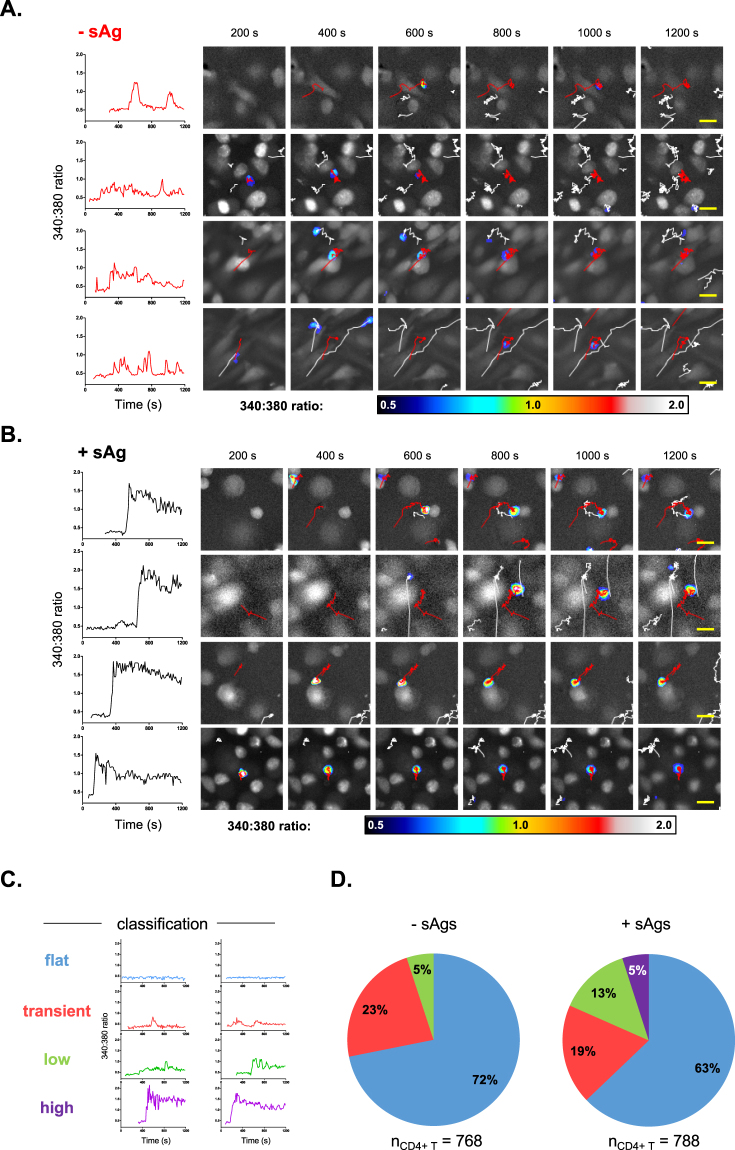
Figure 3.
Single cell analysis of time-lapse images reveals that CD4+ T cells exhibit distinct intracellular calcium signatures when interacting with sAgs-pulsed MDMs. (A and B) Intracellular calcium profiles of CD4+ T cells recorded with a 340:380 ratio exceeding the threshold value (≥1); plots show the intracellular calcium fluxes of CD4+ T cells over time, when perfused over untreated (A) or sAgs-pulsed (B) MDMs; the MDM (large white cell) interacting CD4+ T cell considered in each plot is visible in the adjacent image frames, highlighted with a red track and labeled according to the 340:380 color-scale. (C) Calcium signatures of CD4+ T cells on MDMs were grouped into four categories according to their 340:380 ratio profiles, as illustrated with representative plots. (D) Charts indicating the percentage of CD4+ T cell calcium signatures classified into each group in the presence and absence of sAgs. Scale bars = 20 µm.

