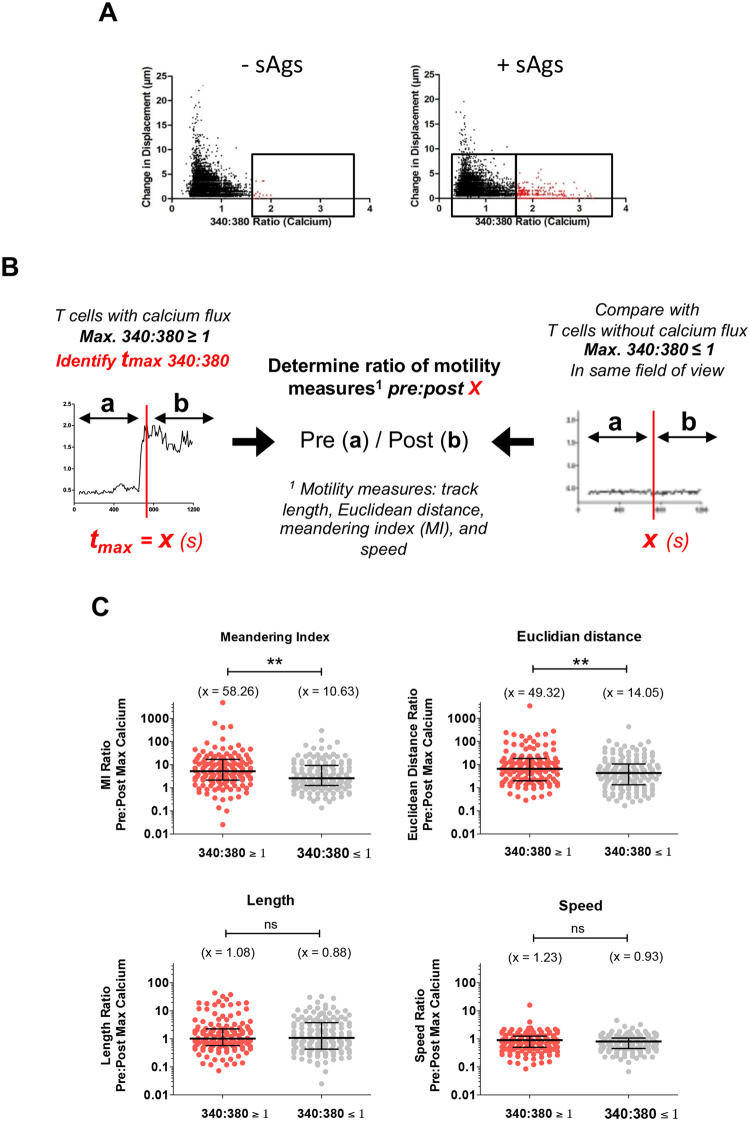
Figure 4.
Analysis of the change in motility parameters either side of the maximum calcium signal tracked. (A) CD4+ T cells were perfused over sAgs-spiked or untreated MDMs. Scatter plots show individual “objects” (T cells) identified in every image frame from live imaging experiments with cells from one donor. The change in displacement measures how far that object has moved since the previous time frame. Objects with 340:380 ratios greater than two standard deviations above the mean (i.e. ratios >1.636) of maximum calcium intensities are highlighted in red. (B) Diagram of the pre:post max 340:380 ratio analysis adopted to determine differences in motility before and after calcium flux within a background of a flow rate that decreases over time and can differ between regions imaged in different lateral positions. (C) Comparison of meandering index (MI) ratio, Euclidean distance ratio, length ratio and speed ratio before and after the max 340:380 signal. Each point represents an individual cell measured from donor (n = 3) samples treated with sAgs [Mean, x; Bars: median ± interquartile range. Statistical analysis: Mann Whitney U test].

