Figure 5.
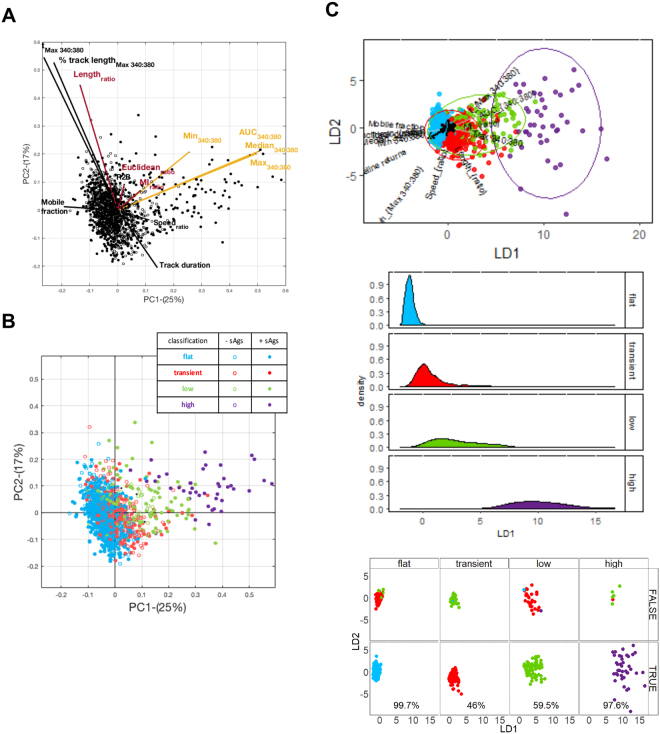
Multivariate data analysis: Observations (n = 1391) for 13 measures of T cell responses ±sAgs projected on to the first two principal components (A and B) and linear discriminants (C). (A) PCA bi-plot projecting observations from sAgs-treated (closed symbols) and untreated (open symbols) samples; lines indicate the contribution of each measure to the two axes. (B) PCA bi-plot projecting the same observations according to the visual calcium classification. (C) LDA assessing calcium signatures separation (‘Flat’ blue, ‘transient’ red, ‘low’ green, ‘high’ purple): Bi-plot of the first two LD scores identifying the calcium profile groups with 95% confidence ellipses for individual groups (top panel); density plots of the first linear discriminate (middle panel) and class prediction plots (bottom panel) demonstrate the reliability of classification to the ‘flat’ and ‘high’ categories of calcium signatures; percentage of predictions that agree with visual classification is given.

