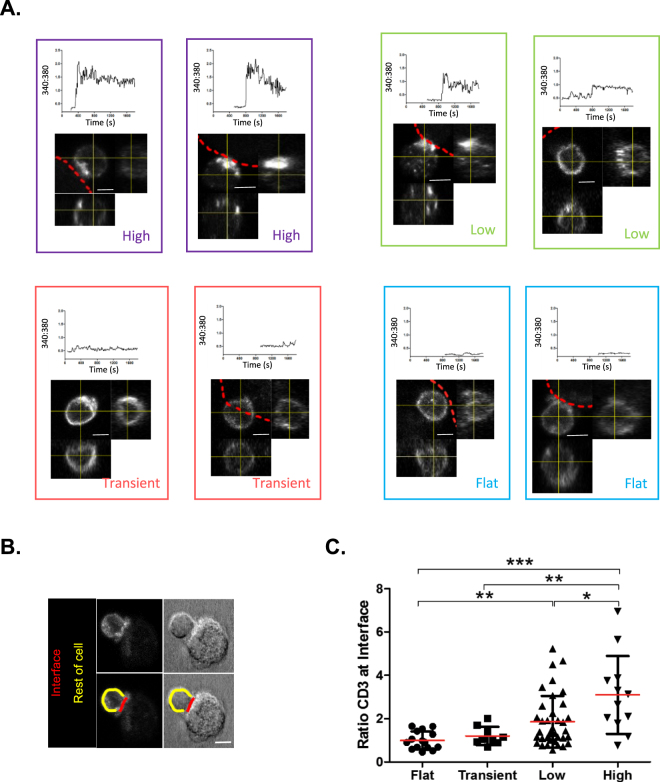
Figure 6.
Correlative imaging approach to assess CD4+ T cell calcium signatures from immune synapses. Following live recording of intracellular calcium, samples were fixed, permeabilized and stained to identify synapses by accumulation of CD3 at the MDM-CD4+ T cell interface. A pre-defined point of reference on the glass-bottom dish help to mark out the position of the original field of view to Z stack confocal images, and allows correlation between the intracellular calcium profile and CD3 capping on individual CD4+ T cells. (A) Calcium profiles (classified into the indicated group) and their corresponding orthogonal views of CD3 accumulation at the MDM-CD4+ T cell interface. The leading edge of the interacting MDM is indicated by the red dotted line; scale bars = 5 µm. (B) Diagram of the method used to determine accumulation ratio of the CD3 marker to the cell-cell interface. (C) Accumulation of CD3 occurs within each class of calcium signatures, but the accumulation ratio significantly increases with the intensity of the calcium signal. Experiments were performed on cells from N = 4 donors; statistical comparison was performed using ANOVA followed by a Tukey post-hoc test.

