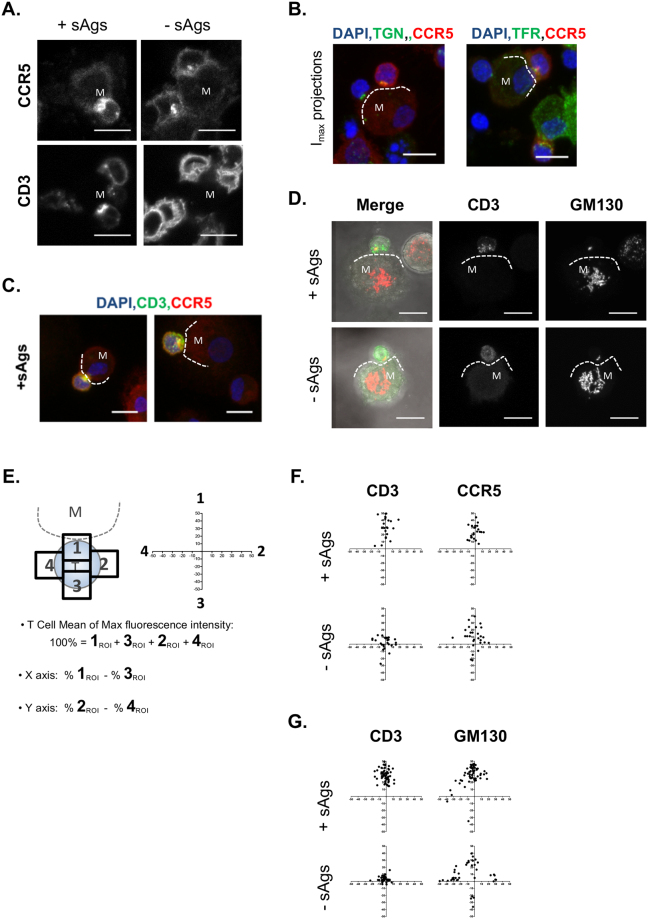
Figure 8.
Polarization of cell surface and internal markers from CD4+ T cell towards the MDM-CD4+ T cell interface. Confocal fluorescence images of MDM-CD4+ T cell conjugates formed ±sAgs and immunolabeled after permeabilization; the edge of the interacting MDM (M) is identified with a dotted line; scale bars = 10 µm. (A) Comparing total CCR5 and CD3 distribution in the presence and absence of sAgs; representative single sections of conjugates imaged from two to three donors. (B) Panels of maximum intensity projections (Imax) for CCR5 and TGN or TfR co-staining. (C) Z-stack projection of CD4+ T cells-MDM conjugates with sAgs, co-stained for CD3 and CCR5. (D) Confocal fluorescence images show CD3 and T cell GM130 polarized towards the interface of cell conjugates stained permeabilized. (E) Diagram of the method used to quantify the polarization of total (surface and internal) staining from CD4+ T cells in conjugates. (F) Plots showing the distribution of total CCR5 and CD3 quantified from at least 23 conjugates ±sAgs (N = 2 donors). (G) Distribution of GM130 and total CD3 quantified from 40 and 60 conjugates ±sAgs (N = 2 and 3 donors, respectively).

