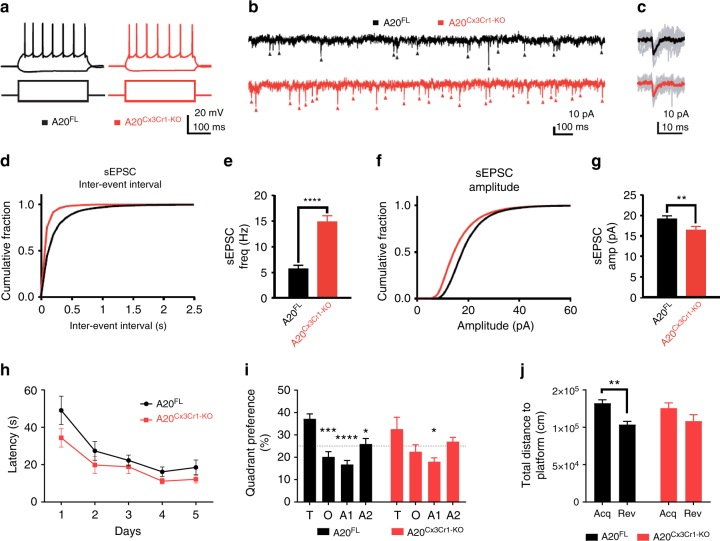
Fig. 2.
Effect of microglia hyperactivation on basal network activity in somatosensory pyramidal neurons. a Example action potential (AP) firing profiles, showing the typical regular spiking behavior of layer V S1 pyramidal neurons both in control and in A20Cx3Cr1-KO neurons. Responses to hyperpolarizing (−150 pA) and suprathreshold (400 pA) current injections are shown. b Example sEPSC traces, 2s stretches. c Examples of individual sEPSC events. Individual events shown in gray, averaged event shown as overlay (control, black; A20Cx3Cr1-KO, red). d Cumulative probability distributions of inter-event sEPSC intervals (IEIs) for control (black) or A20Cx3Cr1-KO (red) cells. e sEPSC frequency (control (black) 5.76 ± 0.58 Hz, n/m = 21/3; A20Cx3Cr1-KO (red) 14.8 ± 1.29 Hz, n/m = 20/3; ****p < 0.0001). Data represents means ± SEM. Number of cells (n), number of animals (m). Statistical differences were determined by a two-tailed Wilcoxon matched-paired t-test. f Cumulative probability distributions for sEPSC amplitudes in control (black) or A20Cx3Cr1-KO (red) cells. g sEPSC amplitudes (control 19.3 ± 0.69 pA, n/m = 21/3; A20Cx3Cr1-KO 16.5 ± 0.87 pA, n/m = 20/3; **p = 0.0013). Data represents means ± SEM. Number cells (n), number of animals (m). Statistical differences were determined by a two-tailed unpaired Mann–Whitney t-test. h Cognitive flexibility in Morris water maze reversal learning was similar in control (A20FL, n = 12) and A20Cx3Cr1-KO mice (n = 9). i In the reversal probe trial, controls displayed significant target quadrant preference, while A20Cx3Cr1-KO mice did not (T: target quadrant, O: opposite quadrant, A1: adjacent 1 quadrant, A2: adjacent 2 quadrant). Chance level at 25% is indicated. j During the reversal probe trial, control animals searched closer to the correct reversal location for the platform than to the old location (distance to platform), while A20Cx3Cr1-KO mice searched at equidistance to both locations. All data (h–j) are represented as means ± SEM and statistical differences were determined by repeated measures two-way ANOVA (h, i) and two-way ANOVA (j) using Bonferroni correction for post hoc analysis (h–j) (*p < 0.05, **p < 0.01, ***p < 0.001, ****p < 0.0001)

