Fig. 5.
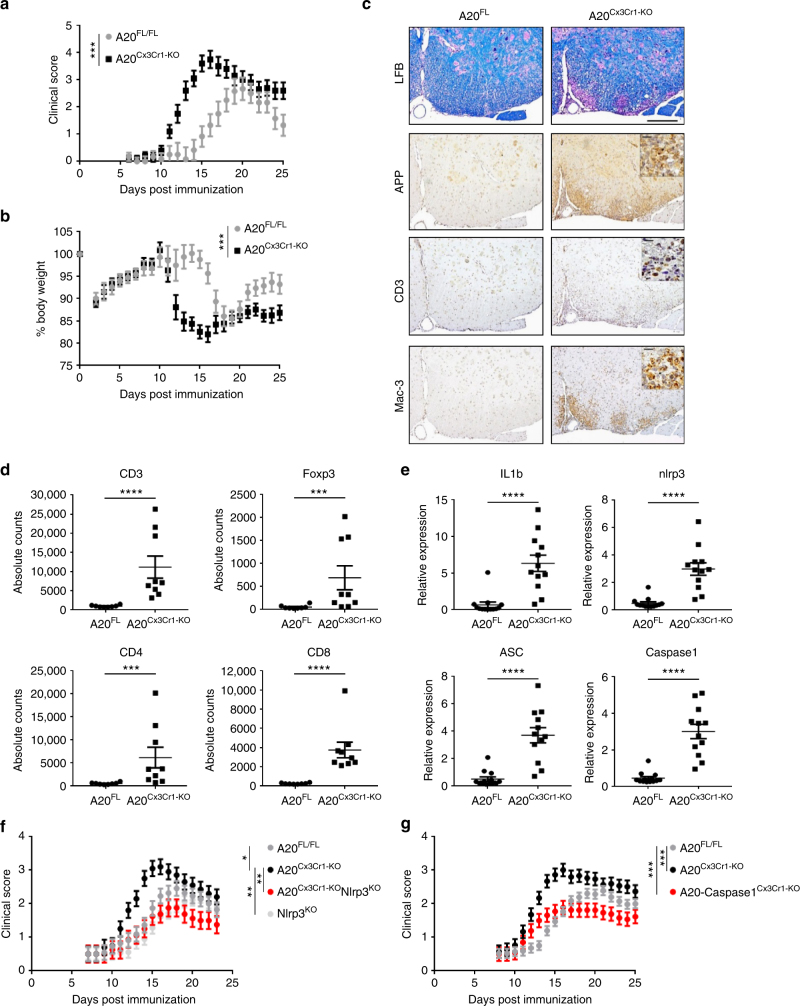
Microglia A20 deficiency aggravates autoimmune CNS inflammation due to Nlrp3 inflammasome hyperactivation. a, b EAE was induced by active immunization of control A20FL (n = 6) and A20Cx3Cr1-KO mice (n = 10) with MOG peptide, and clinical disease development (a) and body weight (b) was followed over time. Each data point represents the mean ± SEM as estimated by the REML analysis. Changes in clinical score and relative body weight differ significantly (***p < 0.001; F-test) between genotypes across the time span. Data are representative of three independent experiments. c Representative images of spinal cord of control (A20FL) and A20Cx3Cr1-KO mice 13 days post immunization using LFB, APP, CD3, and MAC-3 antibodies. Scale bars represent 200 µm (overview) and 20 µm (zoom). Representative images from at least four mice per group are displayed. d Assessment of immune cell (CD3, CD4, and CD8 T cell, Treg) infiltration in the CNS of control (A20FL) and A20Cx3Cr1-KO mice by flow cytometry just before disease onset. Each symbol represents one mouse. Data are expressed as mean ± SEM and significant differences are determined by a Mann–Whitney U-statistical test (***p < 0.001, ****p < 0.0001). e Expression of inflammasome-associated factors in the spinal cord of TAM-injected control (A20FL) and A20Cx3Cr1-KO mice 12 days post immunization. Each symbol represents one mouse. Data are expressed as the ratio of the mRNA expression normalized to endogenous housekeeping genes and expressed as mean ± SEM. Significant differences are determined by a Mann–Whitney U-statistical test (****p < 0.0001). f, g Active immunization of control (A20FL, n = 11), A20Cx3Cr1-KO (n = 10), Nlrp3KO (n = 18), and A20Cx3Cr1-KO-Nlrp3KO (n = 8) mice (f) and of control (A20FL, n = 28), A20Cx3Cr1-KO (n = 15) and A20/caspase-1Cx3Cr1-KO (n = 13) mice (g), and clinical disease development over time. Each data point represents the mean ± SEM as estimated by the REML analysis. Changes in clinical score and relative body weight differ significantly between genotypes across the time span (*p < 0.05, **p < 0.01, ***p < 0.001; F-test). Graph represents combined data from three independent experiments

