
Figure 2.
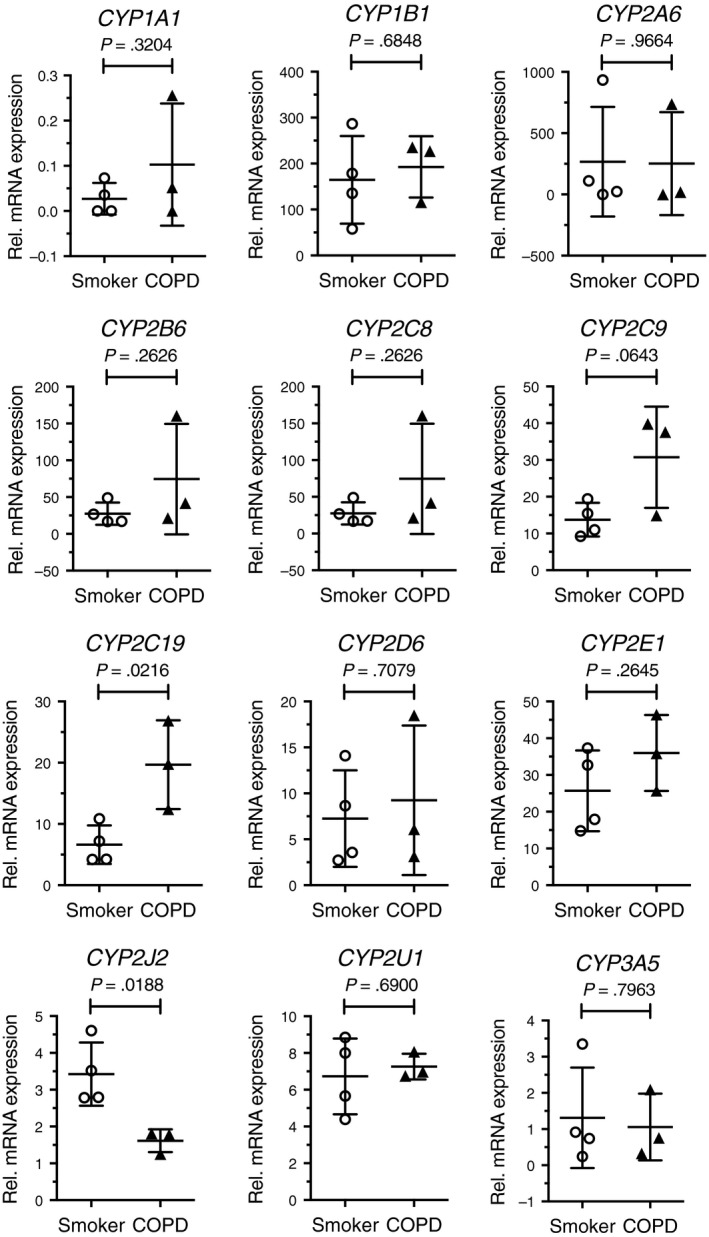
Comparison of mRNA expression of 12 CYP enzymes in ATII cells between smokers without COPD (n = 4) and patients with COPD (n = 3). n indicated the number of individuals. Each dot represents an individual and bars indicate the mean ± SD. Two‐tailed unpaired t‐test was used for statistics