
Fig. 1.
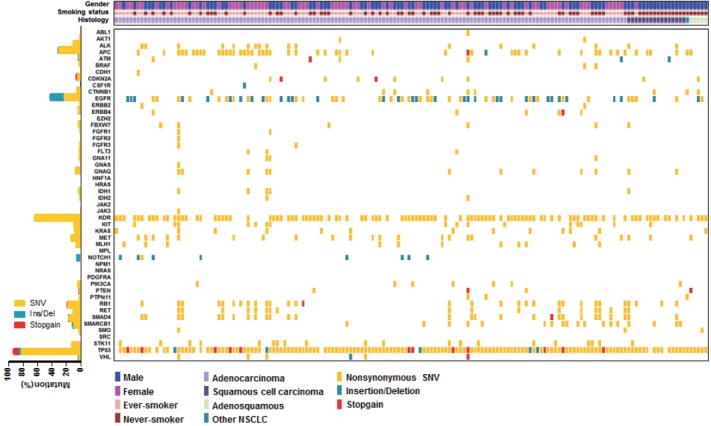
Heatmap of mutations found in 162 non-small cell lung cancer samples. In the upper panel, the first row indicates sex, the second row smoking status, and the third row histology. A histogram shows the percentage of mutations in each gene (let). The horizontal axis presents the complete dataset of patients and the vertical axis illustrates mutated genes (right).