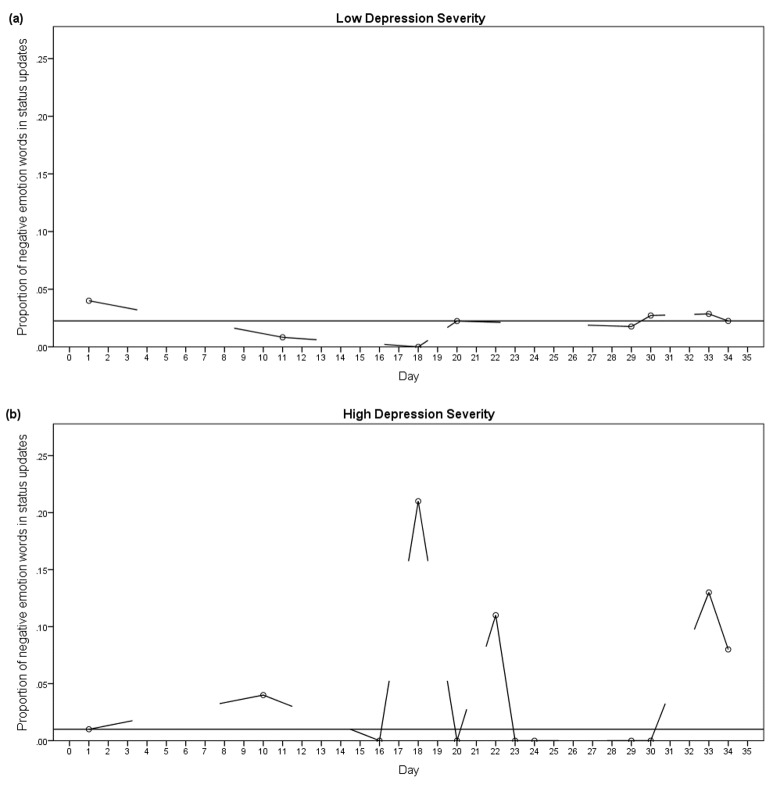
Figure 3.
Graphs showing the proportion of negative emotion words used in individual status updates on Facebook across 35 days. (a) Shows an individual with low self-reported depression severity (Patient Health Questionnaire-9, PHQ-9 score=9) who demonstrated little post-to-post variation in the proportion of negative emotion words used, with the maximum difference of .03. The horizontal trend line shows the median proportion of negative emotion words used (.022) and interpolation lines link consecutive status updates. (b) Shows an individual with high self-reported depression severity (PHQ-9 score=22), who demonstrates large post-to-post changes in the proportion of negative emotion words used in status updates with the largest difference being .21. The horizontal trend line shows the median proportion of negative emotion words used (.01) and interpolation lines link consecutive status updates.

