
Figure 4.
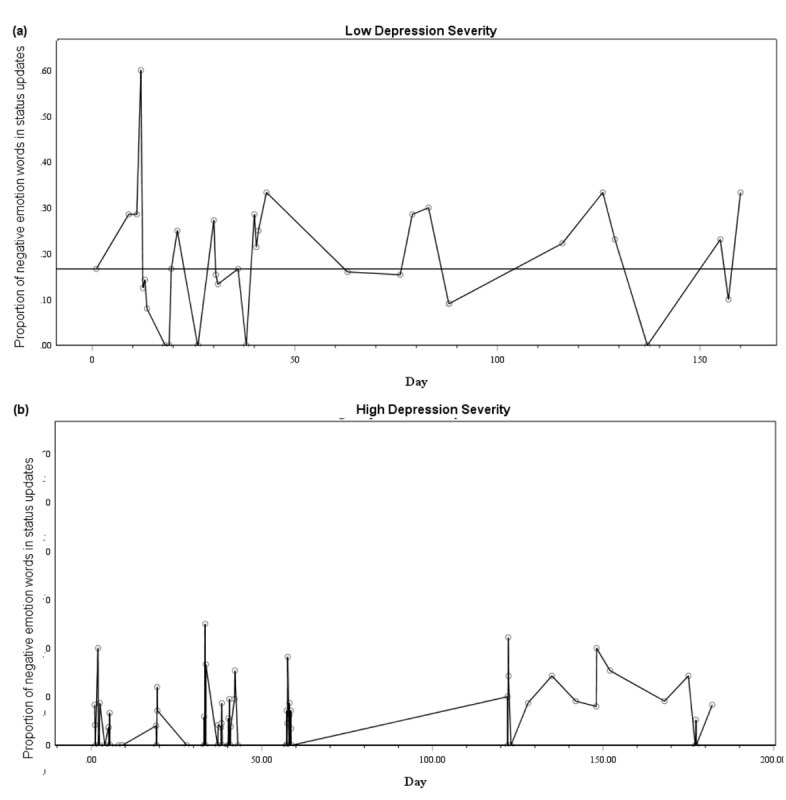
Graphs showing the proportion of negative emotion words used in individual status updates across (a) 160 and (b) 182 days. (a) Shows an individual with low self-reported depression severity (Patient Health Questionnaire-9, PHQ-9 score=8) and high variability in the proportion of negative emotion words used across their recording period. The horizontal trend line shows the median proportion of negative emotion words (.17) and interpolation line links status updates. (b) Shows an individual with high self-reported depression severity (PHQ-9 score=16) and low variability in the proportion of negative emotion words used across their recording period. The median proportion of negative words used was .00 and is therefore not shown. The interpolation line links status updates.