Fig. 4.
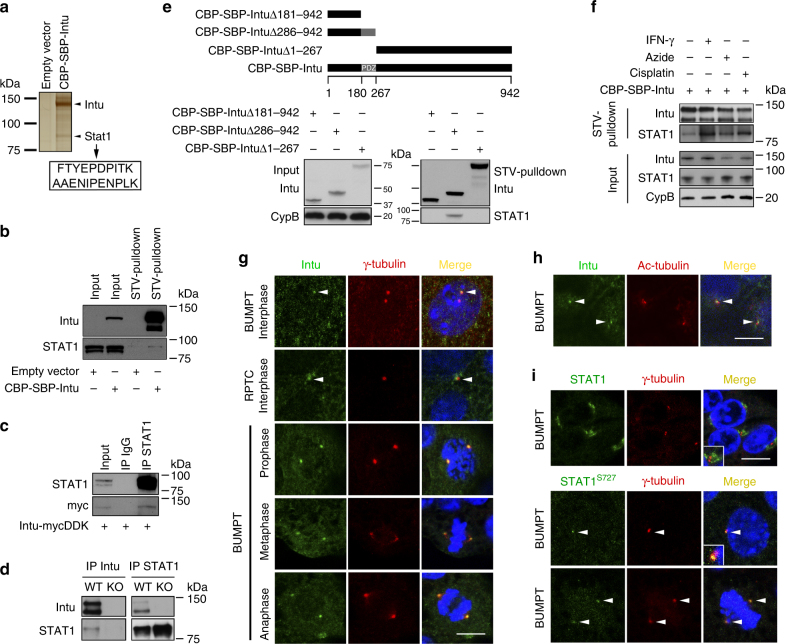
STAT1 is a novel Intu-interacting protein at the basal body/centriole area. a To identify Intu-interacting proteins, Intu was transiently expressed in BUMPT cells, followed by Intu pulldown by the TAP assay. Eluted proteins from the TAP were subjected to SDS-PAGE and silver staining. One band at ~90 kDa was analyzed by mass spectrometry identifying two peptides of STAT1 (in arrowed box). b Intu constructs (or empty vector) were transiently transfected into BUMPT cells and STV-pulldown assay was performed to determine the co-precipitation of Intu and STAT1. c Intu-mycDDK was transfected into 293FT cells to collect lysate for immunoprecipitation of STAT1 with anti-STAT1 antibody or non-immune IgG (control). The precipitates were then analyzed for STAT1 and myc-tagged Intu to show their co-precipitation or interaction. d Co-immunoprecipitation of Intu and STAT1 in kidney tissues of PT-Intu-KO or WT mice after renal IRI. e Intu deletion mutants were transfected into BUMPT cells. After STV-pulldown, the Intu N-terminus containing PDZ domain (CBP-SBP-Intu ∆268-942) precipitated endogenous STAT1 while the mutants lacking this domain did not. f Intu and STAT1 interaction during IFN-γ, azide, and cisplatin treatment. 293FT cells were transfected with Intu constructs (CBP-SBP-Intu) and subjected to different treatments. Cell lysate was collected for STV-pulldown assay to show that more STAT1 was pulled down by Intu in treated 293FT cells. g Double immunofluorescence of Intu and γ-tubulin (marker of basal body/centriole) showing their co-localization in cultured mouse (BUMPT) and rat (RPTC) kidney proximal epithelial cells at different cell cycle phases. h Double immunofluorescence of Intu and Ac-tubulin (marker of cilia) showing the localization of Intu at the base of primary cilia. i Double immunofluorescence of Phospho-STAT1S727 and γ-tubulin revealed their co-localization, while double immunofluorescence of total STAT1 and γ-tubulin showed the distribution of total STAT1 around basal body/centrioles. In three panels g–i, cells were also stained with DAPI to show nuclear morphology in merged images. Arrow-head: basal body/centriole. Scale bar: 10 µm

