Fig. 3.
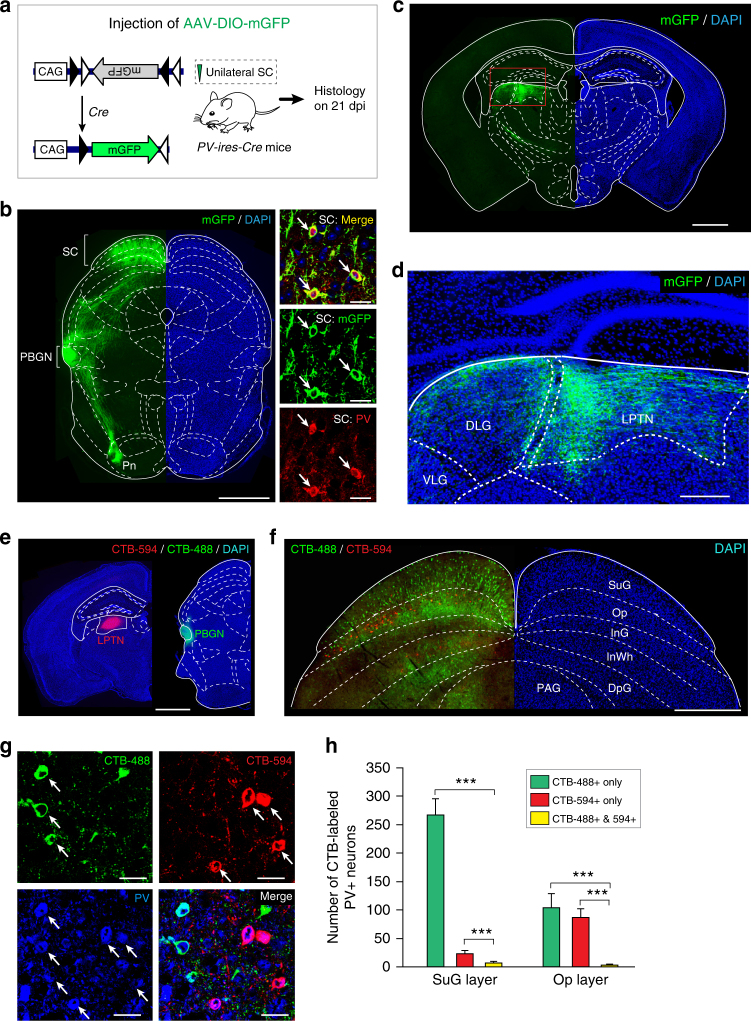
Distinct SC PV+ neurons divergently project to the PBGN and LPTN. a Schematic diagram showing AAV-DIO-mGFP injection into the SC of PV-ires-Cre mice. b Coronal section (left) and example micrographs (right) showing specific expression of mGFP in SC PV+ neurons. Arrows indicate PV+ neurons. Scale bars, 1 mm (left) and 30 μm (right). For quantitative analyses, see Supplementary Fig. 4a. c, d Coronal section (c) and its cropped region (d) showing mGFP+ axon terminals of SC PV+ neurons in the LPTN and other adjacent thalamic nuclei. For the whole-brain mapping of SC PV+ neuron targets, see Supplementary Fig. 4a and 4b. Scale bars, 1 mm (c) and 200 μm (d). e Schematic diagram showing ipsilateral injection of CTB-594 into the LPTN and CTB-488 into the PBGN of the same mice. Scale bar, 1 mm. f Example coronal section of the ipsilateral SC showing the distribution of retrogradely labeled cells projecting to the PBGN (CTB-488+, green) and LPTN (CTB-594+, red). Scale bar, 0.5 mm. For single-channel micrographs, see Supplementary Fig. 4c. g Example micrographs from Op layer showing a large proportion of PBGN-projecting (CTB-488+) and LPTN-projecting neurons (CTB-594+) were positive for PV. Arrows indicate CTB-488+ and CTB-594+ neurons that are also positive for PV. Scale bars, 25 μm. h Quantitative analyses of the laminar distribution of SC PV+ neurons projecting to the PBGN (CTB-488+) and LPTN (CTB-594+). Data in (h) are means ± SEM (error bars, n = 3 mice). Statistical analysis was Student’s t test (***P < 0.001)

