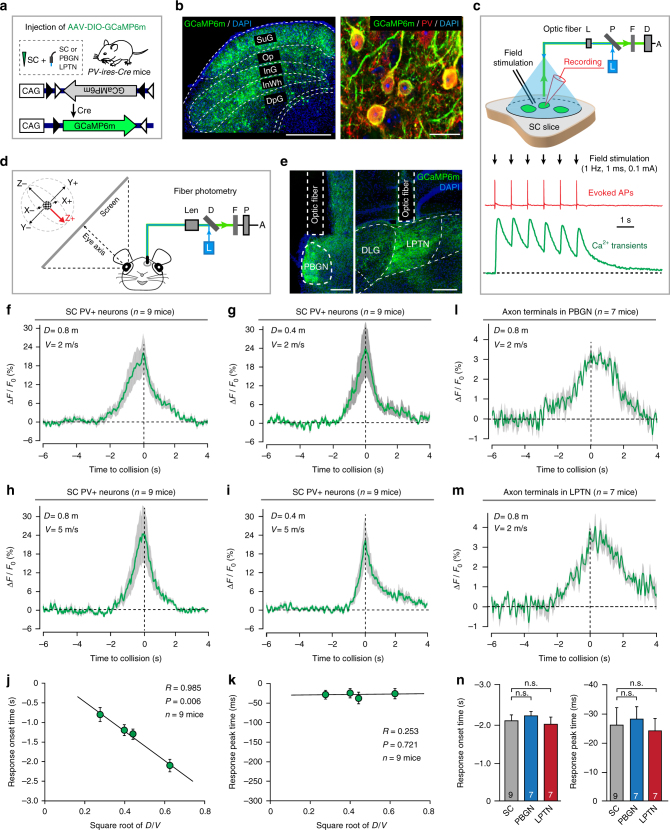
Fig. 4.
SC PV+ neurons transmit threat-relevant visual signals to the PBGN and LPTN. a Diagram showing AAV-DIO-GCaMP6m injection into the SC followed by optic fiber implantation above the SC, PBGN or LPTN of PV-ires-Cre mice. b Micrographs of the SC showing expression of GCaMP6m in PV+ neurons. Scale bars, 0.5 mm (left) and 25 μm (right). For single-channel micrographs and quantitative analyses, see Supplementary Fig. 5a. c Validation of fiber photometry by simultaneous recording of action potentials (APs) and Ca2+ transients from SC PV+ neurons in SC slices. The evoked APs (red) and Ca2+ transients (green) were synchronized with field stimulation train. d Schematic diagram showing in vivo fiber photometry to record Ca2+ transients in anesthetized mice. A virtual soccer ball moving in six orthogonal directions (±X, ±Y, ±Z) was displayed on an oblique screen facing directly to the eye axis. e Fiber tracks above the GCaMP6+ axon terminals in the PBGN (left) and LPTN (right). Scale bars, 0.2 mm. f−i Averaged peri-stimulus time course of Ca2+ transients from SC PV+ neurons of nine mice to the looming ball with controlled velocity (V = 2 or 5 m s−1) and diameter (D = 0.4 or 0.8 m). For responses in other directions, see Supplementary Fig. 5b. j, k Correlation analyses of response onset time (j) or peak time (k) vs. square root of D/V of the looming ball. l, m Time course of Ca2+ transients from PV+ axon terminals in the PBGN (l) and LPTN (m) to the looming ball (D = 0.8 m, V = 2 m s−1). n Comparison of response onset time (left) and peak time (right) between SC PV+ neurons and their axon terminals in the PBGN or LPTN. Cloudy area in (f−i, l, m) indicates SEM of the averaged data. Data in (j, k, n) are means ± SEM (error bars). Statistical analysis was Student’s t test (n.s. P > 0.1)

