Fig. 7.
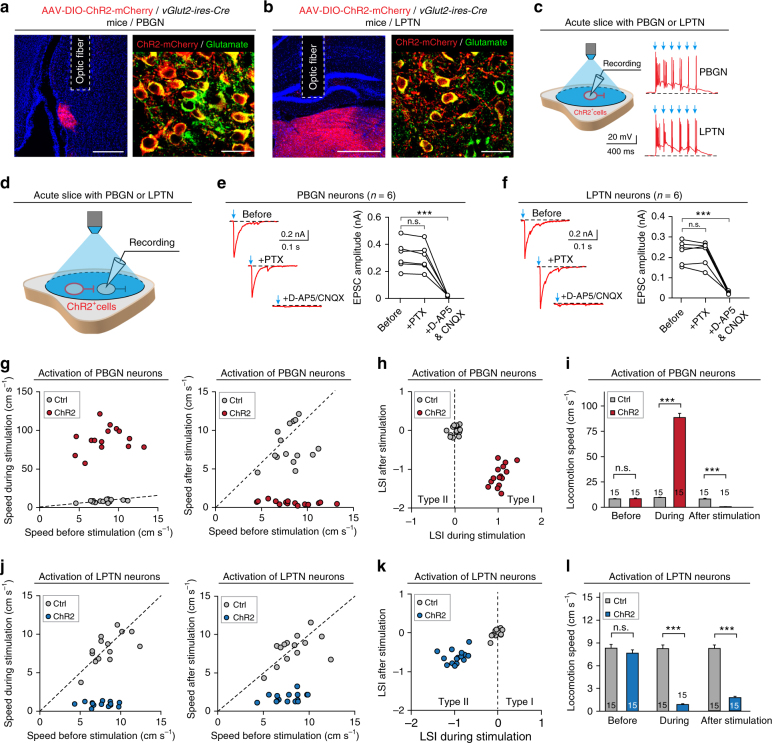
Selective activation of glutamatergic neurons in the PBGN and LPTN triggers dimorphic defensive response patterns. a, b AAV-DIO-ChR2-mCherry was locally injected into the PBGN (a, left) and LPTN (b, left) of vGlut2-ires-Cre mice, resulting in the specific expression of ChR2-mCherry in glutamate+ neurons in the PBGN (a, right) and LPTN (b, right). Scale bars, 0.4 mm (left) and 30 μm (right) for (a) and (b). For single-channel micrographs and quantitative analyses, see Supplementary Fig. 7g and h. c In acute slice with the PBGN or LPTN, light-pulse trains (473 nm, 1 ms, 10 Hz, 6 pulses, 20 mW) reliably evoked APs from ChR2-mCherry+ neurons in the PBGN and LPTN. d Schematic diagram showing recording of light-evoked PSCs from ChR2-mCherry-negative neurons in acute slice with PBGN or LPTN. e, f Effects of PTX and D-AP5/CNQX on light-evoked PSCs recorded from ChR2-mCherry-negative neurons in the PBGN (e) and LPTN (f). g, j Distributions of locomotion speed of mice during vs. before (left) and after vs. before (right) optogenetic activation of PBGN (g) and LPTN neurons (j). h, k Distribution of LSIduring stimulation and LSIafter stimulation of mice with (ChR2) or without (Ctrl) optogenetic activation of PBGN (h) and LPTN neurons (k). i, l Quantitative analyses of speed before, during, and after optogenetic activation of PBGN (i) and LPTN neurons (l). Data in (i, l) are means ± SEM (error bars). Numbers of mice are indicated in the bars. Statistical analysis (e, f, i, l) was Student’s t test (***P < 0.001; n.s. P > 0.1)

