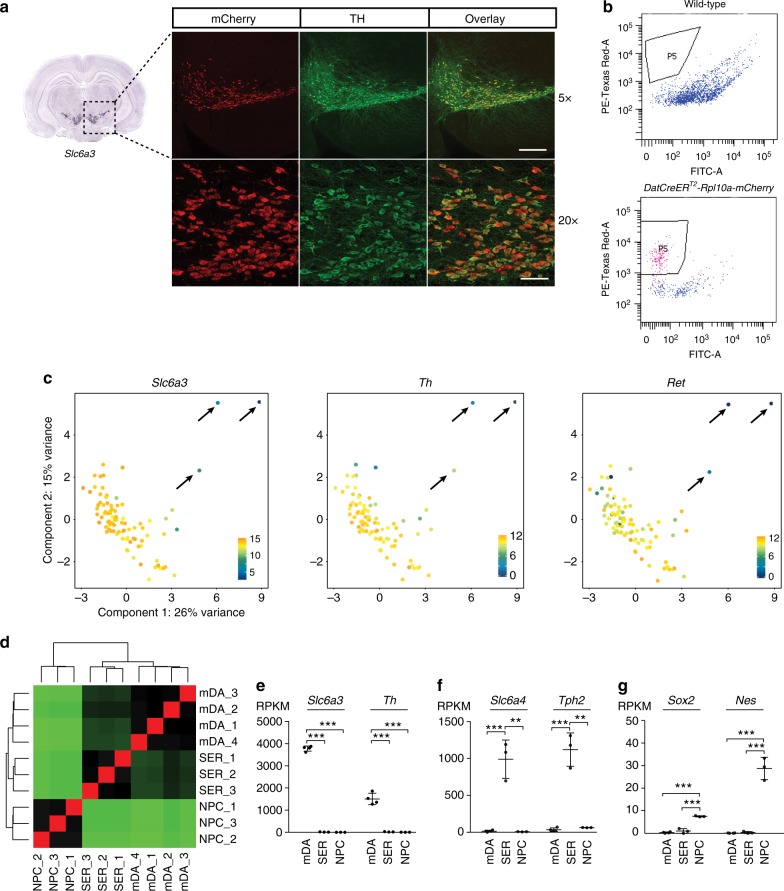
Fig. 1.
Purification of adult neuronal and neural progenitor nuclei. a Rpl10a-mCherry expression (red) overlaps TH (green) expression in the ventral midbrain in DatCreERT2-Rpl10a-mCherry mice. 5x and 20x magnification. To the left is an in situ hybridization for Slc6a3 taken from the Allen Brain Atlas (mouse.brain-map.org, image credit: Allen Institute), indicating the position of the images. Scale bars: 200 μm (upper panels), 50 μm (lower panels). b FACS plots showing a population of nuclei, indicated by “P5,” occurring in DatCreERT2-Rpl10a-mCherry mice but not in wild-type mice. Single-nuclei RNA-seq: c PCA-plots constructed from normalized single-nuclei log-expression values of correlated HVGs. Each nucleus is colored according to the expression of Slc6a3, Th, or Ret. Arrows indicate three outlier nuclei identified as originating from non-mDA neurons. A total of 1000 nuclei bulk RNA-seq: d Heatmap showing sample-to-sample distances between hierarchically clustered mDA, SER, and NPC RNA-seq libraries. e Expression of dopaminergic neuron markers is restricted to mDA nuclei: bars indicate average RPKM ± SD for Slc6a3 and Th as RPKMs in mDA (n = 4 mice), SER (n = 3 mice), and NPC nuclei (n = 3 embryos). f Expression of serotonergic markers is restricted to SER nuclei: bars indicate average RPKM ± SD for Slc6a4 and Tph2 as RPKMs in mDA, SER, and NPC nuclei. g Expression of neural progenitor markers is restricted to NPC nuclei: bars indicate average RPKM ± SD for Sox2 and Nes as RPKMs in mDA, SER, and NPC nuclei. Significance for e–g according to two-tailed Student’s t-test assuming equal variances. ***p ≤ 0.001, **p ≤ 0.01

