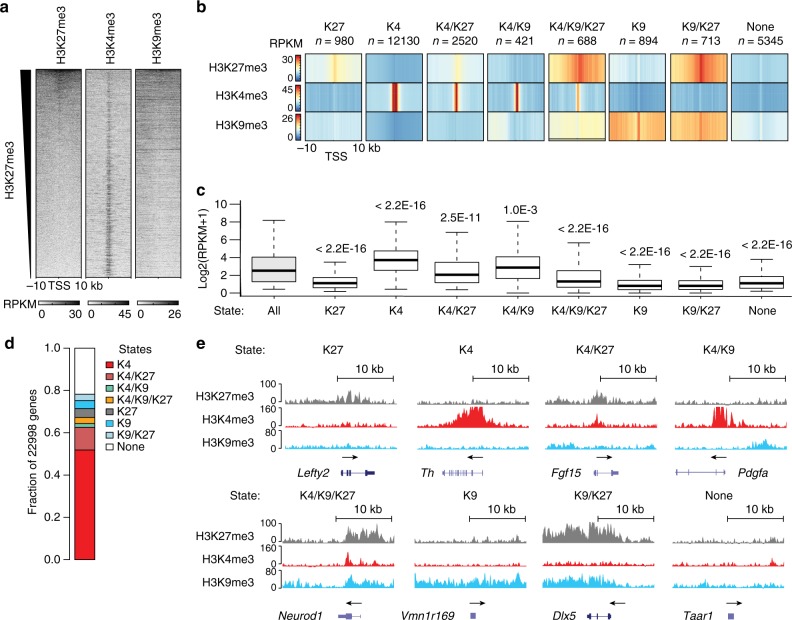
Fig. 2.
Histone modifications and gene expression in adult mDA neurons. a H3K27me3 and H3K9me3 abundance around TSS is inversely correlated with H3K4me3 abundance: Heatmaps showing genome-wide abundance of H3K27me3, H3K4me3, and H3K9me3 ± 10 kb around TSS of individual genes in mDA neurons as RPKMs obtained by ChIP-seq. Heatmaps were sorted for descending H3K27me3 abundance. b Categorization of TSS regions into chromatin states: Heatmap profiles of average H3K27me3, H3K4me3, and H3K9me3 RPKMs ± 10 kb around TSS of genes per defined chromatin state in mDA neurons (denoted as K27, K4, K4/K27, K4/K9, K4/K9/K27, K9, K9/K27, and None, respectively). c Individual chromatin states are associated with different levels of gene expression: box-plots showing the expression levels (log2(RPKM + 1)) of genes in the different chromatin-state categories. The center line is the median, bounds are the 25th and 75th percentiles, and whiskers are ±1.5 IQR. Chromatin states with an average gene expression that is different compared to the global average gene expression are indicated by p-values obtained by a two-sided Wilcoxon rank-sum test. d Genome-wide relative abundance of ChIP-seq defined chromatin states in promoter regions ±10 kb around TSS in mDA neurons. e UCSC Genome browser excerpts (https://genome.ucsc.edu) showing examples of enrichment for H3K27me3 (gray, vertical scale 0–100 RPKM), H3K4me3 (red, vertical scale 0–160 RPKM), and H3K9me3 (blue, vertical scale 0–80 RPKM) at representative genes per chromatin state in mDA neurons. Each plot spans 20 kb

