Fig. 4.
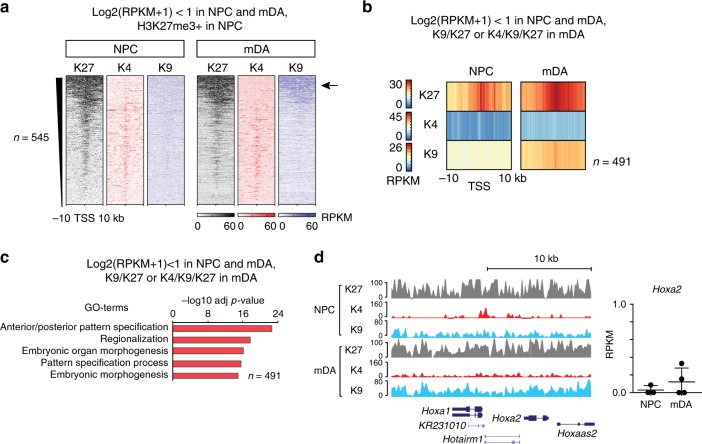
Expansion of H3K27me3/H3K9me3 onto silenced genes in mDA neurons. a Genes repressed and H3K27me3-marked in both NPC and mDA gain H3K9me3 during terminal differentiation into mDA neurons: ChIP-seq heatmaps showing the abundance of H3K27me3, H3K4me3, and H3K9me3 as RPKMs ± 10 kb around TSS in NPC and mDA of silent (log2(RPKM + 1) < 1) and H3K27me3-marked genes in NPC. The arrow indicates a subset of silent and H3K27me3-marked genes displaying an increase in H3K9me3 in mDA compared to NPC. b Heatmap profiles of average H3K27me3, H3K4me3, and H3K9me3 RPKMs ± 10 kb around TSS of silent genes (log2(RPKM + 1) < 1) in NPC and mDA and categorized as K9/K27 or K4/K9/K27 in mDA. c Gene ontology (GO) of the top (−log10 (adj p-value), Fisher’s exact test) biological processes for silent genes (log2(RPKM + 1) < 1 in NPC and mDA neurons as in b that were K9/K27 or K4/K9/K27 in mDA neurons (n = 491). d Example of a silent and H3K27me3-marked gene in NPC that gains H3K9me3 in mDA: Left: UCSC Genome browser excerpt showing enrichment for H3K27me3 (gray, vertical scale 0–100 RPKM), H3K4me3 (red, vertical scale 0–160 RPKM), and H3K9me3 (blue, vertical scale 0–80 RPKM) within the Hoxa-locus. Right: Bars indicate average RPKM ± SD for Hoxa2, which is <1 in NPC and mDA

