Fig. 5.
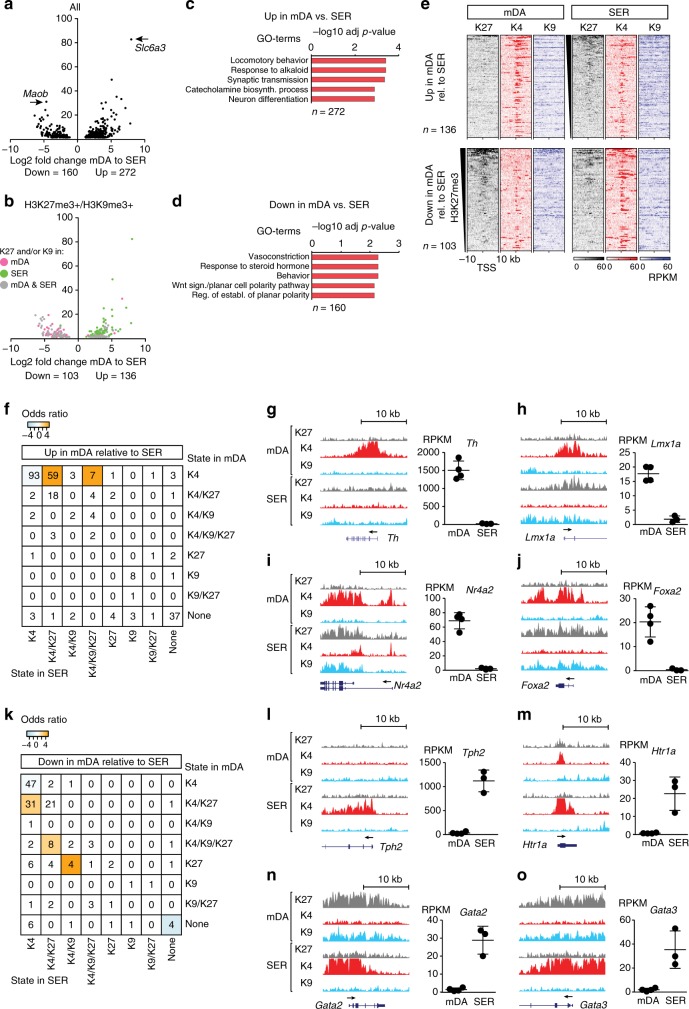
Subtype-specific chromatin landscapes define adult neurons. a RNA-seq: Volcano plot showing differential gene expression between SER and mDA neurons. Differentially expressed genes with an adjusted p-value < 0.05 obtained by Wald test are shown. b Volcano plot as in a, differentially expressed and H3K27me3 and/or H3K9me3-marked genes colored according to: marked in mDA – pink, marked in SER – green, and marked in both mDA and SER – gray. c Gene ontology (GO) of selected (−log10 (adj p-value), Fisher’s exact test) biological processes for upregulated genes in mDA relative to SER (n = 272). d As in b for downregulated genes in mDA relative to SER (n = 160). e ChIP-seq heatmaps showing the abundance of H3K27me3, H3K4me3, and H3K9me3 as RPKMs ± 10 kb around TSS of genes upregulated in mDA relative to SER neurons and associated with a chromatin state containing H3K27me3 and/or H3K9me3 in mDA and/or SER (top panels), and genes downregulated in mDA relative to SER neurons and associated with a chromatin state containing H3K27me3 and/or H3K9me3 in mDA and/or SER (bottom panels). f Chromatin-state transitions between SER and mDA neurons for upregulated genes in mDA relative to SER. Colored squares indicate transitions that occurred significantly more often than expected (odds ratio, orange = more than expected, blue = less than expected, and p < 0.05 according to Fisher’s exact test and adjusted for multiple testing). g–j Left: UCSC Genome browser excerpts showing examples of H3K27me3- (gray, vertical scale 0–100 RPKM), H3K4me3- (red, vertical scale 0–160 RPKM), and H3K9me3 enrichment (blue, vertical scale 0–80 RPKM) around the Th, Lmx1a, Nr4a2, and Foxa2 loci. Each plot spans 20 kb. Right: Bars indicate average RPKM ± SD for Th, Lmx1a, Nr4a2, and Foxa2 in mDA and SER neurons, respectively. k Chromatin-state transitions between SER and mDA neurons for downregulated genes in mDA relative to SER as in f. l–o Left: UCSC Genome browser excerpts showing examples of enrichment of H3K27me3 (gray, vertical scale 0–100 RPKM), H3K4me3 (red, vertical scale 0–160 RPKM), and H3K9me3 (blue, vertical scale 0–80 RPKM) around the Tph2, Htr1a, Gata2, and Gata3 loci. Each plot spans 20 kb. Right: Bars indicate average RPKM ± SD for Tph2, Htr1a, Gata2, and Gata3 in mDA and SER neurons, respectively

