Figure 4.
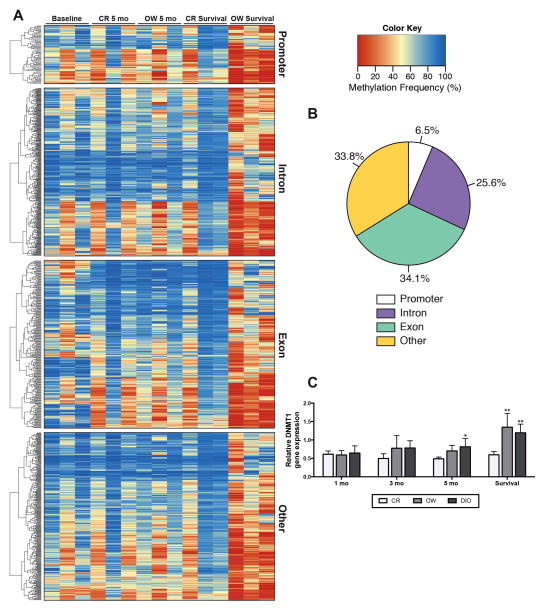
Differences in dietary energy balance impact genome wide methylation patterns in the mammary tissue. (A) Heat map and clustering dendrogram of mammary tissue DNA methylation. CpG dinucleotides with significant differences in methylation (CR survival vs. OW survival) are shown and clustered within genomic location, i.e. promoter, exon, intron, other. Baseline, CR and OW after 5 months on diet and CR and OW survival study mice are each represented (n = 3/group, with one column per n shown). The methylation frequency percentage ranges from 0 to 100. A value of ‘0’ is completely unmethylated and ‘100’ is fully methylated. Statistical differences (CR vs. OW survival) determined by logistic regression and the likelihood ratio test, p-values were adjusted with the success likelihood index method. (B) Representation of genomic locations of differentially methylated CpG dinucleotides, 6.5% mapped to a promoter region, 34.1% mapped to a gene exon, 25.6% mapped to an intron region, and 33.8% did not map to a promoter, exon or intron and are classified as ‘other.’ (C) Mammary DNMT1 mRNA levels, measured by qualitative real time PCR, in mice maintained on CR, OW, and DIO diet regimens for 1, 3 and 5 months or through survival. Data are presented as relative to baseline levels (n = 4 mice). Statistical differences in DNMT1 expression determined by one-way ANOVA *P < 0.05, **P < 0.01, ***P < 0.001.

