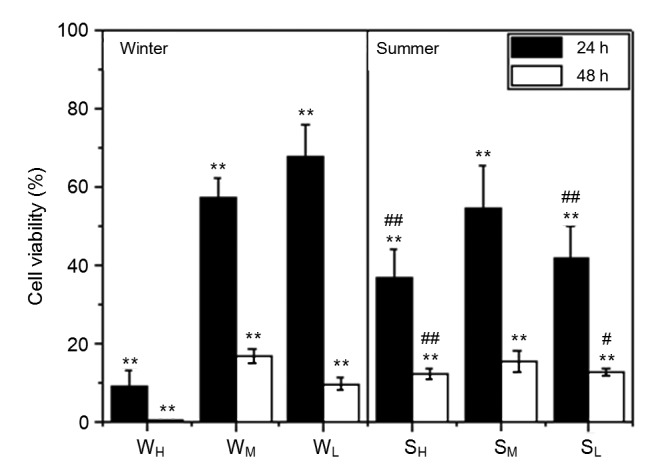
Fig. 4.

Cell viability after exposure to the water extraction solution of PM2.5
Sample groups are compared to control groups, where ** indicates a significant difference. Summer severe, mild, and good weather groups are compared to the corresponding winter samples, where # indicates a significant difference at 0.05, and ## indicates a significant difference at 0.01
