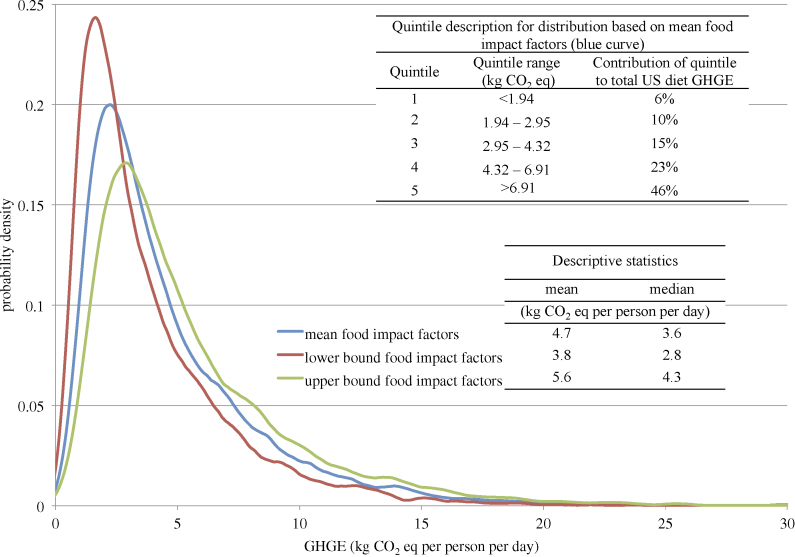
Figure 1.
Distribution of diet-related GHGE per person per day among US adults, National Health and Nutrition Examination Survey 2005–2010. Data are based on one 24 hour dietary recall per person and include estimated retail- and consumer-level food losses. Distribution in blue is based on using the mean impact (GHGE/kg food) for each food in our database. Distributions in red and green are based on impact factors (GHGE/kg food) at the lower and upper bounds, respectively, of a 95% confidence interval around these mean estimates of impact for each food.

