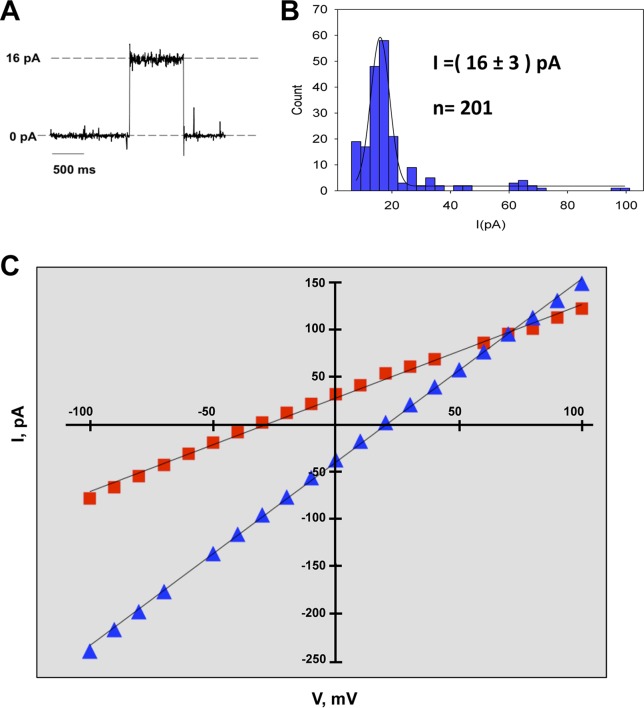
FIG 3 .
Characterization of the SARS-CoV 3a protein ion channel. (A) Recording of a single-channel insertion of SARS-CoV 3a protein. (B) Histogram of current jump amplitude (right) at +100 mV in 500 mM KCl, composed of values from 201 recording events. (C) SARS-CoV 3a protein voltage-independent ion channel. The 3a protein showed a linear current-voltage relationship. Displayed data correspond to representative I-V plots from reversal potential experiments performed with 500/50 mM solutions of monovalent (NaCl, red filled squares) and divalent (CaCl2, blue filled triangles) cations. Each experiment was performed at least three times; the lines represent linear regression fits of data points.

