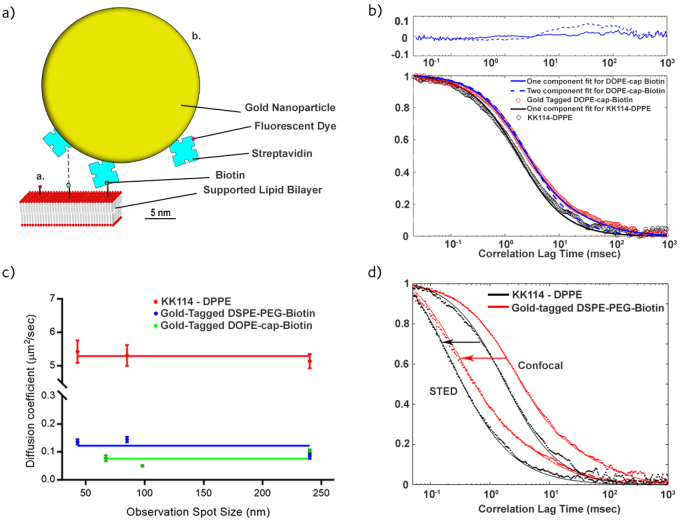
Figure 1.
(a) Schematic scale presentation of the employed fluorescent lipid analogues in the lipid bilayer (red: lipid head groups, grey: lipid chains): tagged with (i) small organic dye (red), and (ii) with a 40 nm gold nanoparticle (yellow) coated with organic-dye (red) tagged streptavidin (blue) binding to a biotinylated (green) lipid, possibly introducing cross-linking to a second biotinylated lipid (dashed line). (b) Representative confocal FCS data taken on the homogeneous DOPC SLB for the fluorescent gold nanoparticle tagged DSPE-PEG-biotin lipid (red circles) with one- (blue dashed line) and two-component fits (solid blue line), and the fluorescent lipid analogue KK114-DPPE (black circles) with one-component fit (black line). Upper panel: residuals of the one- (dashed line) and two-component (solid line) fits to the FCS data taken for the fluorescent gold nanoparticle tagged lipid analogue. (c) Dependence of the apparent diffusion coefficient D on the observation spot diameter d as taken from the STED-FCS recordings of the different fluorescent analogues, KK114-tagged DPPE (red), gold nanoparticle tagged DSPE-PEG-biotin (blue) and gold nanoparticle tagged DOPE-cap-biotin (green) with the average value plotted across the D values as guide for the eyes (solid lines). Mean values (dots) and error bars (standard deviation) from n ⩾ 8 measurements. (d) Representative confocal and STED-FCS data (as labelled, STED for d = 85 nm) taken for the KK114-tagged DPPE (black dots) and fluorescent gold nanoparticle tagged DSPE-PEG-biotin (red dots) in the SLBs, and two-component fits to the data, respectively (solid lines).

