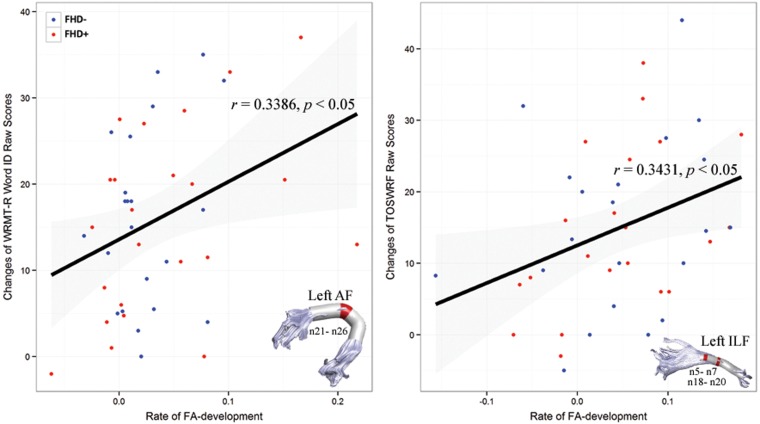
Figure 4.
Scatter plots of rates of FA development versus changes of reading development for the left AF and ILF. The representative node 23 is plotted for the left AF, and the representative node 19 is plotted for the left ILF. Solid black lines represent the linear relationship between rates of FA development and changes of behavioral assessments. Nodes that show significant correlation between rates of FA development and changes of behavioral assessments are marked in red on the 3-dimensional rendered tract ( P < 0.05, FDR-corrected).

